Workload
The following questions were asked in regards to the weekly workload taken on by students. This includes work from both paid/unpaid jobs, as well as time spent caregiving for a family member. Students academic workload is also looked at in order to see the hours spent each week on school work, as well as looking at the combined hours across academic and non-academic responsibilities.
Weekly Paid Work Hours
Estimate the number of hours you work in a PAID job (for
example, server at a restaurant, office assistant, etc.) or paid
internship (for example, training, shadowing, or practicum) per week.
(n=387, 95% of 407 reporting).
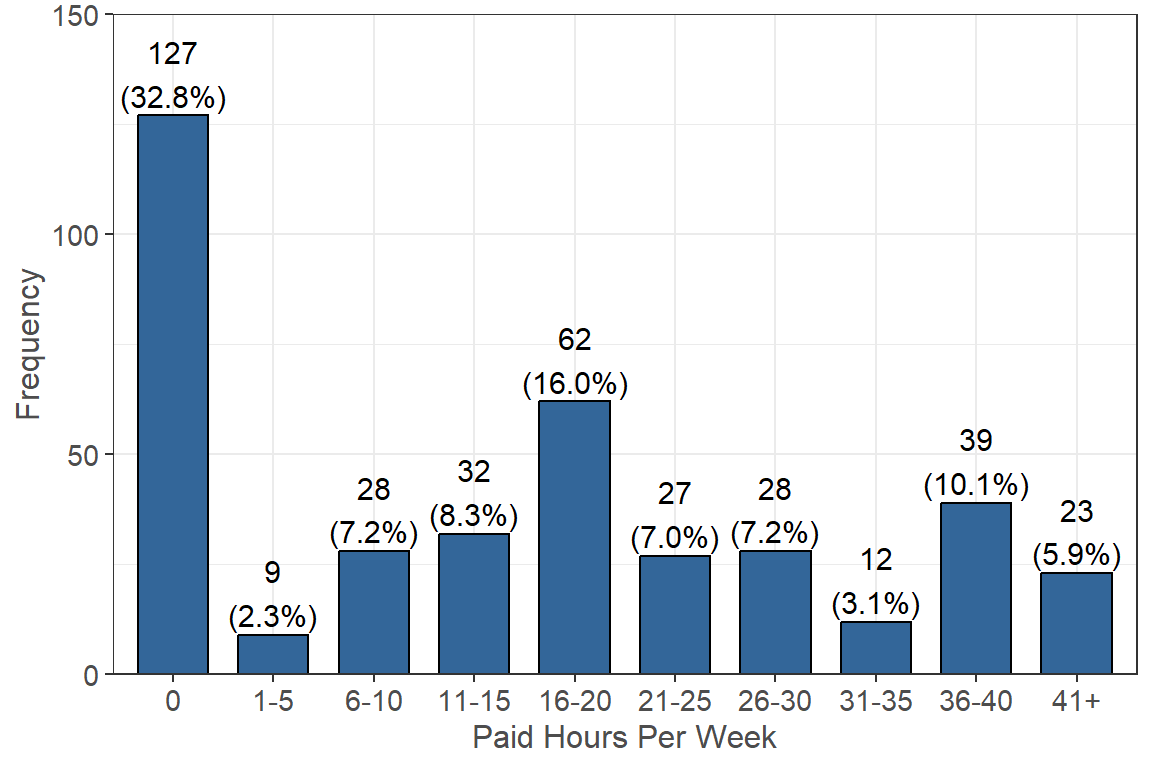 Figure 3.1: Weekly Paid Hour Ranges
The data indicates that the majority of survey participants work either part-time or not at all. Only a small number of participants are considered to be working full-time (40 or more hours per week). Below is a breakdown of the exact paid hours worked by survey participants.
Exact Hours Breakdown
Although the majority of the participants claim to work 0 hours per
week, below is a breakdown of the exact number of hours for those who
claim to work a paid job (n=260, 64% of 407 reporting).
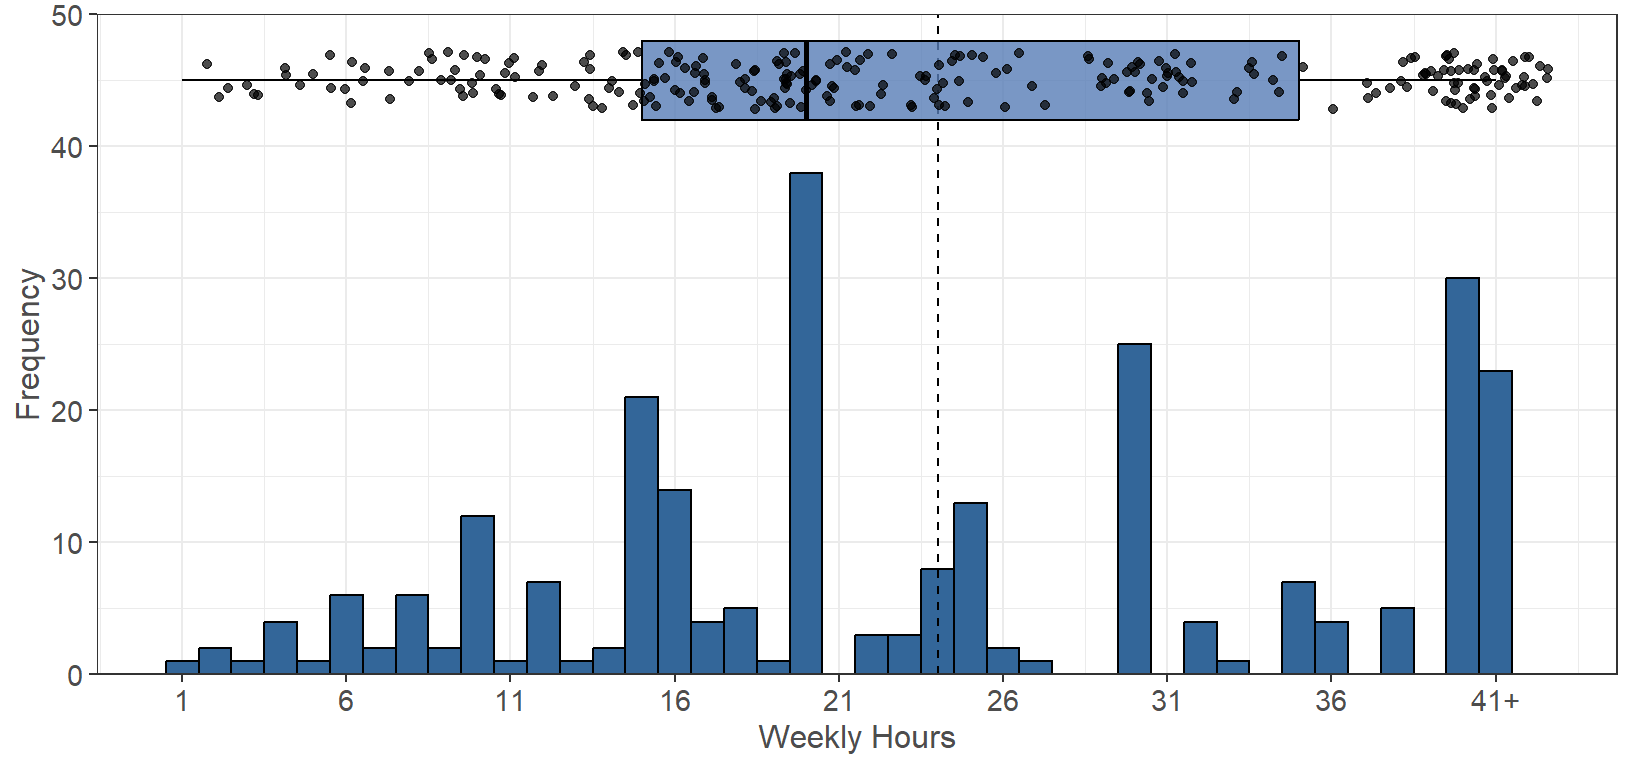 Figure 3.2: Weekly Paid Hours Distribution
Note that “41+” was rounded for 41 in the following analysis for the paid hours worked per week.
The average number of paid hours worked per week (denoted by the dotted line) is 24, while the median is 20 hours. It seems that the majority of students are considered part-time workers (less than 40 hours per week), with 20 hours being most common (NA people) and 40 hours following that.
Impact of COVID
Have the hours you work in a PAID job or internship changed
due to COVID-19? (n=366, 90% of 407 reporting).
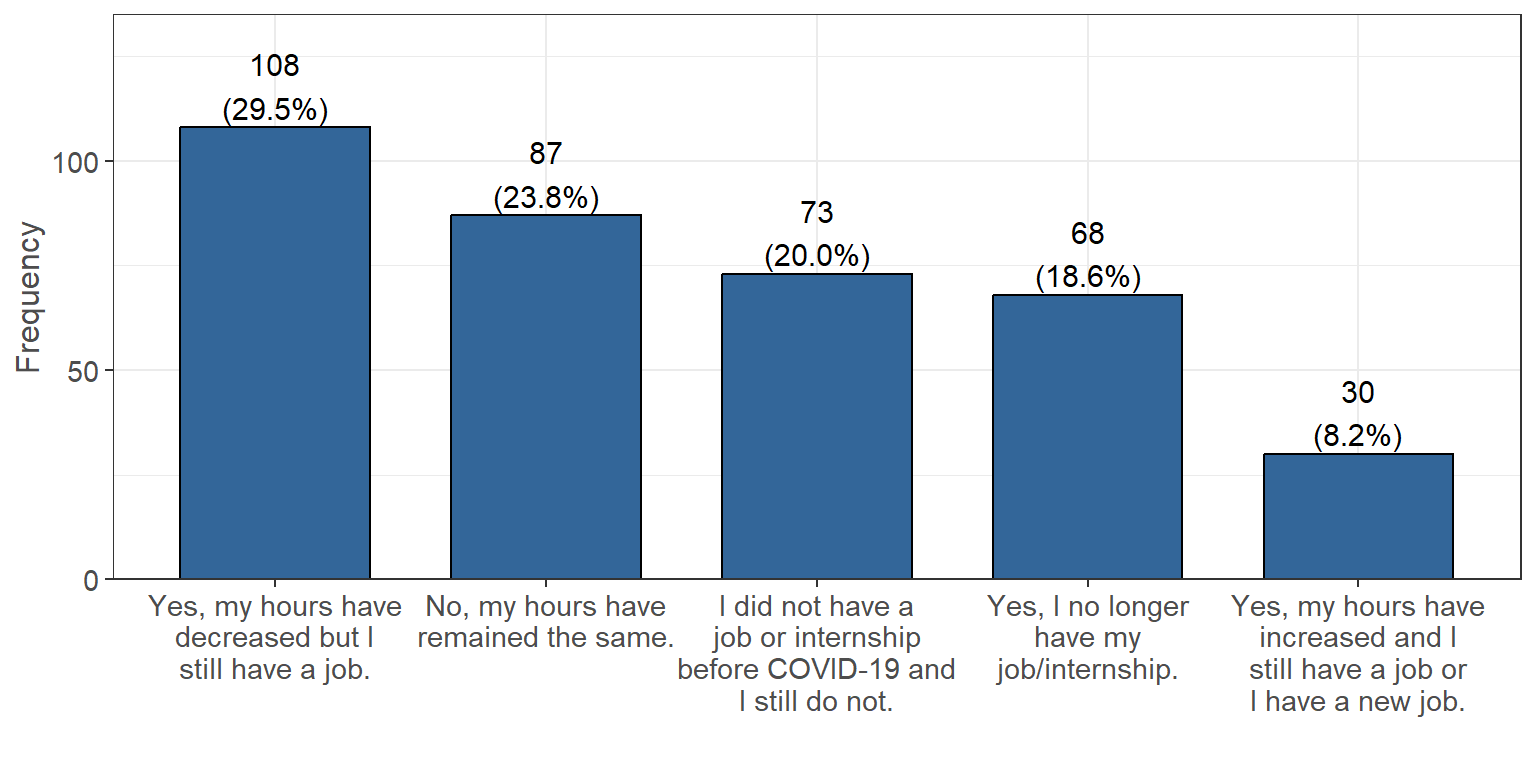 Figure 3.3: COVID Impact on Paid Hours
With the impact of COVID, the data indicates that most survey participants were able to keep their current paid jobs with only slight changes. 108 students had their hours decrease, 87 students maintained the same hours, and 30 students had their hours increase. There was also 68 students who claimed that they no longer had their paid position due to the impact of COVID, while 73 students also claimed that they did not have a paid position before COVID.
Unpaid Work Hours
Estimate the number of hours you work in an UNPAID internship
(for example, training, shadowing, practicum, and/or volunteer, etc.).
Do not combine with answers above. (n=385, 95% of 407
reporting).
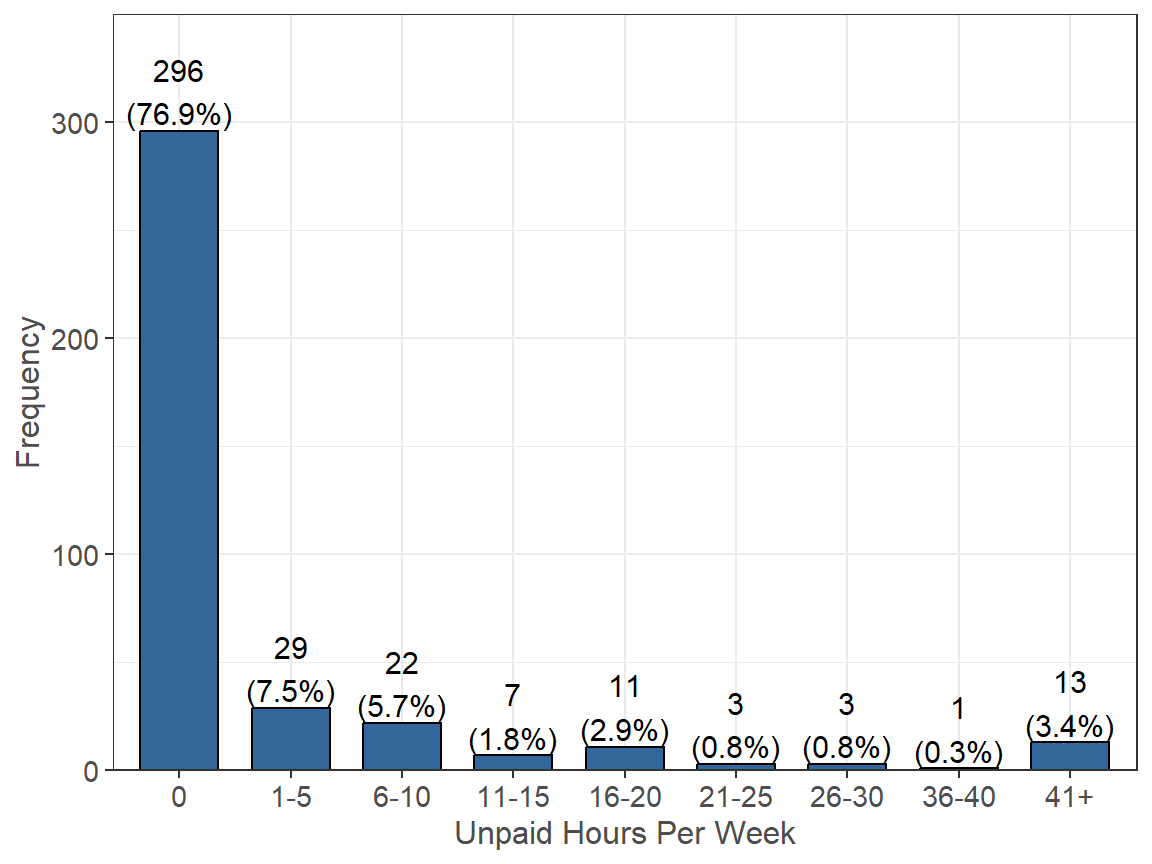 Figure 3.4: Weekly Unpaid Hour Ranges
We can see that the majority of survey participants (296) do not work an unpaid job. A small number of participants work part-time at an unpaid job and only a select few work full-time at an unpaid job. Below is a breakdown of the number of unpaid hours worked per week.
Exact Hours Breakdown
Although the majority of the participants claim to work 0 hours per
week, below is a breakdown of the exact number of hours for those who
claim to work a unpaid job (n=89, 22% of 407 reporting).
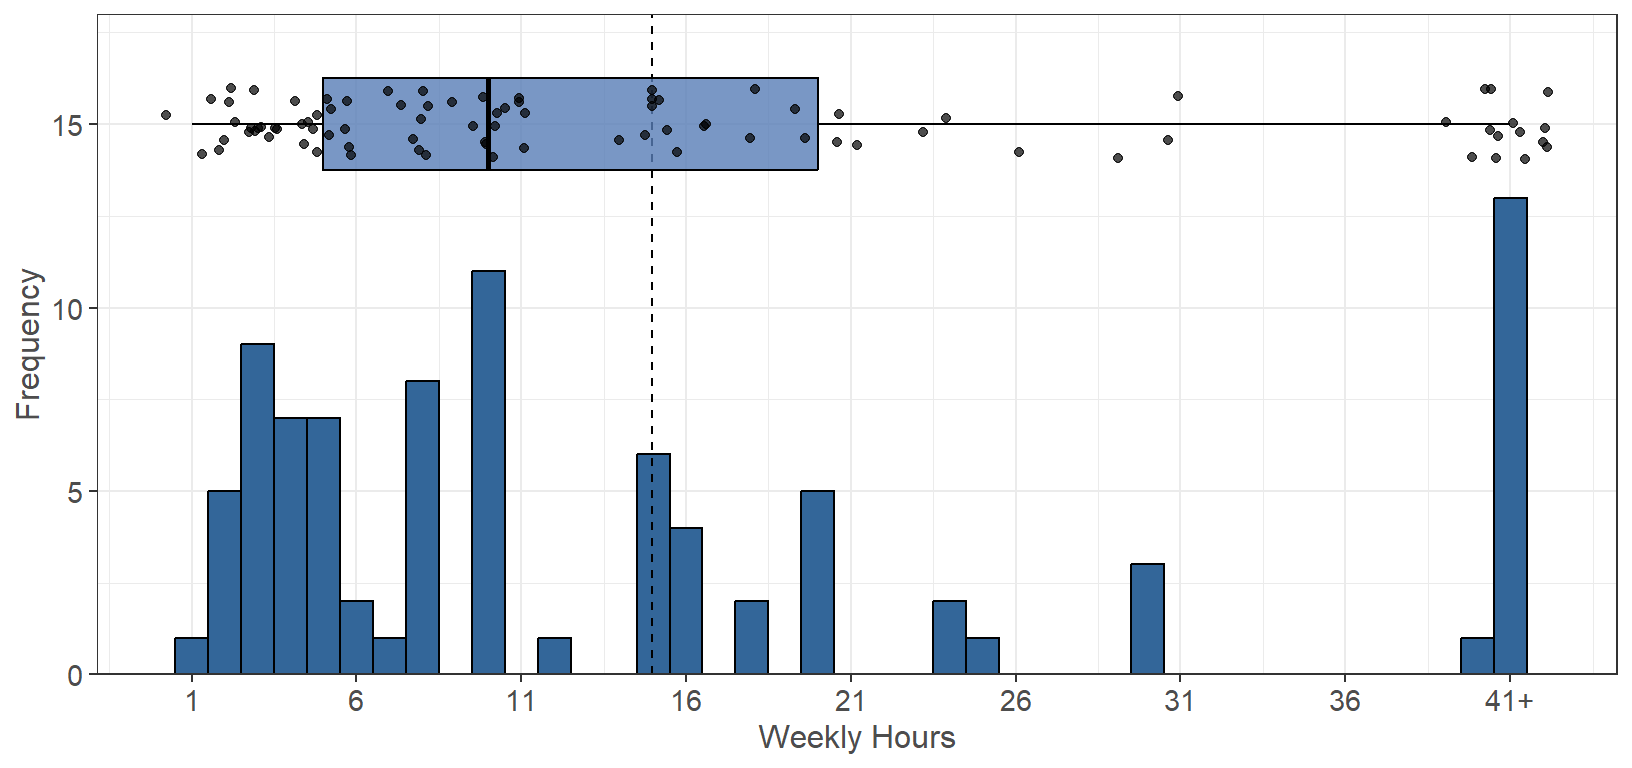 Figure 3.5: Weekly Unpaid Hours Distribution
Note that “41+” was rounded for 41 in the following analysis for the unpaid hours worked per week.
The average number of unpaid hours worked per week (denoted by the dotted line) is 14.97, while the median is 10 hours. It seems that the majority of survey participants do not work unpaid positions, with 41 hours being most common (13 people) and 10 hours following that.
Unpaid Caregiving Hours
Estimate the number of hours you spend each week on unpaid
family obligations (for example, taking care of younger siblings,
preparing family meals, running errands for the family, etc.). (n=387,
95% of 407 reporting).
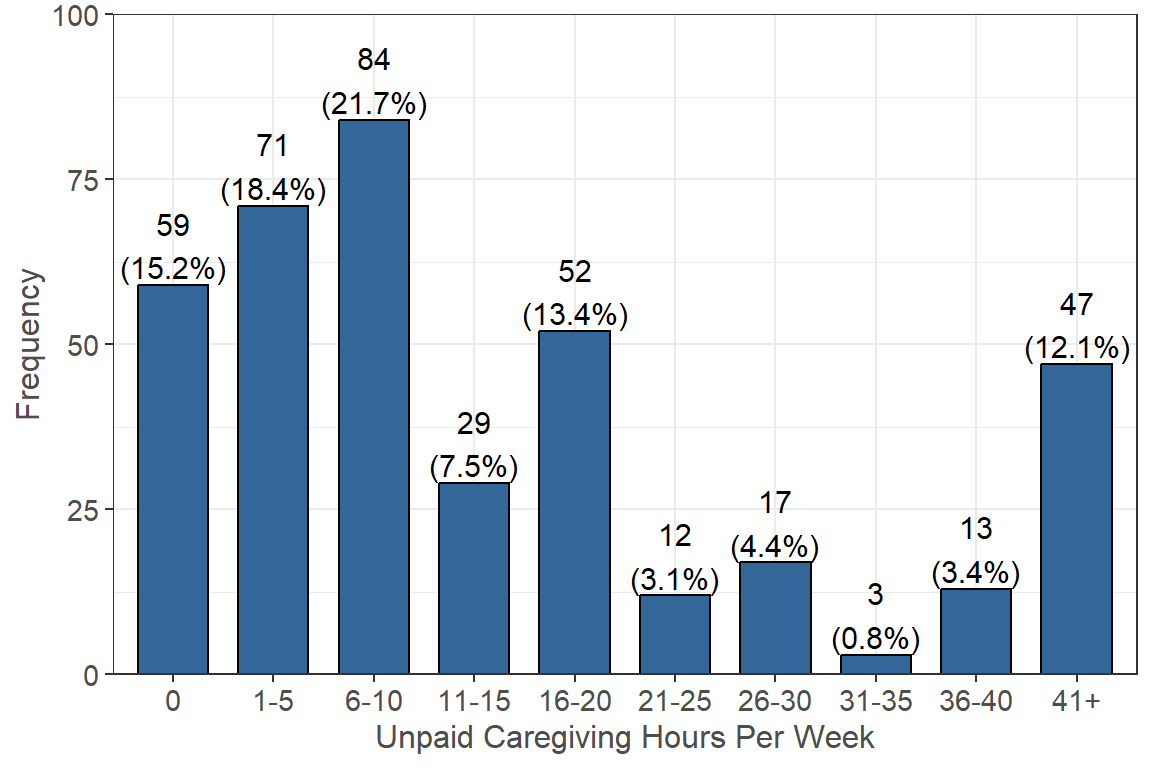 Figure 3.6: Weekly Caregiving Hour Ranges
The data indicates that the majority of survey participants do spend some time each week caring for family members. Only 59 participants estimated that they spent 0 hours per week for family obligations. There are also around the same number of participants who estimated they work full-time (40 or more hours per week) on these family obligations. Below is a breakdown of these unpaid hours spent on family obligations each week.
Exact Hours Breakdown
Although some of the participants claim to work 0 hours per week,
below is a breakdown of the exact number of hours for those who claim to
spend time on unpaid family obligations (n=328, 81% of 407 reporting).
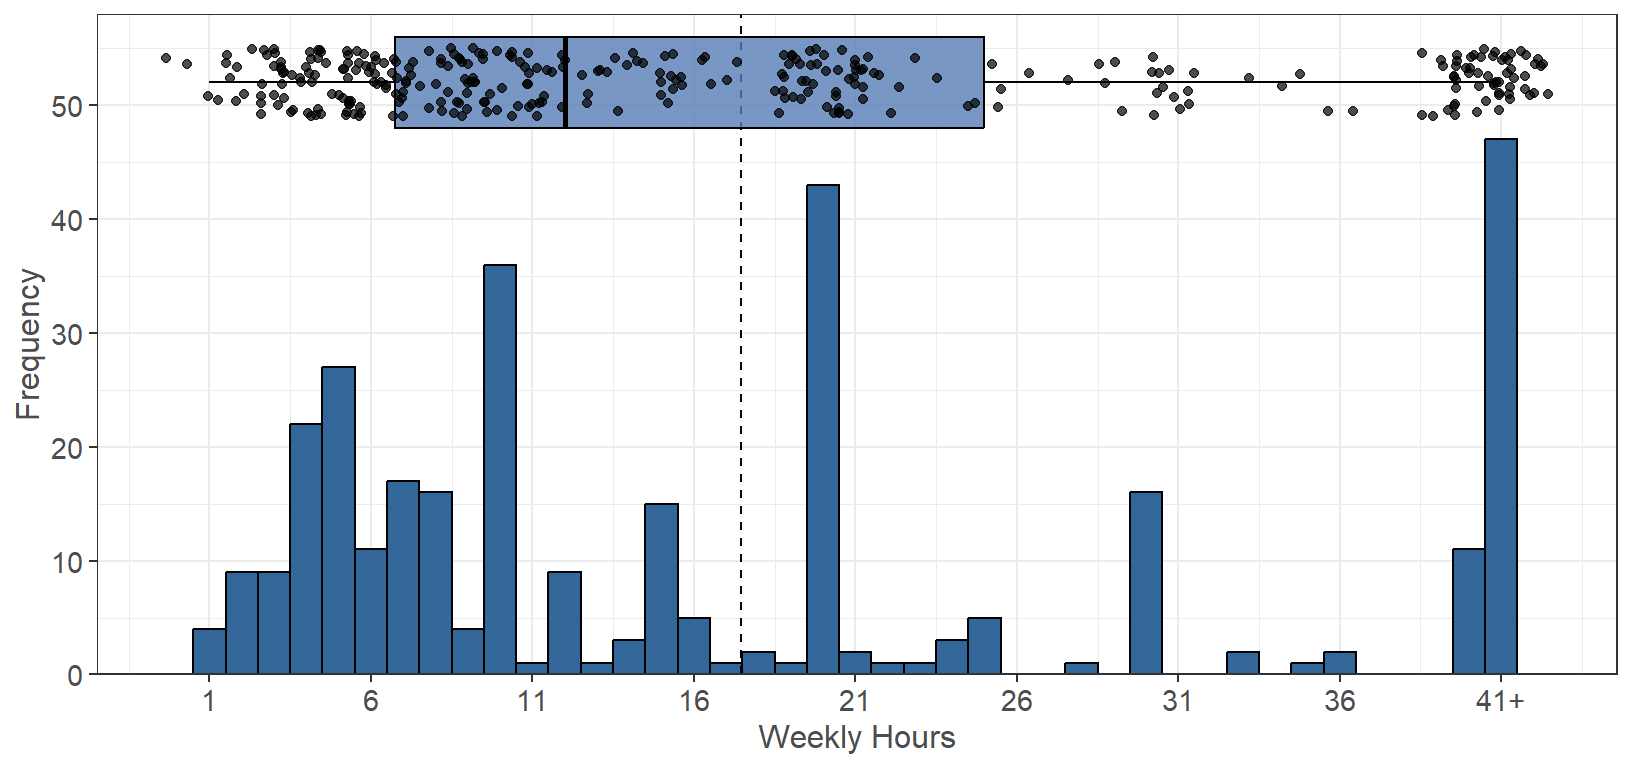 Figure 3.7: Weekly Caregiving Hours Distribution
Note that “41+” was rounded for 41 in the following analysis for the unpaid caregiving hours worked per week.
The average number of unpaid caregiving hours worked per week (denoted by the dotted line) is 17.45, while the median is 12 hours. There does not seem to be a clear pattern in the number of unpaid caregiving hours worked, with 41 hours being most common (47 people) and 20 hours following that (43 people).
Academic Workload
Below is a breakdown of the academic workload, using the 3
hours of work per unit measurement (n=393, 97% of 407
reporting). Note that values denoted as “22+” are now
“66+”, but were rounded to 66 for the analysis below.
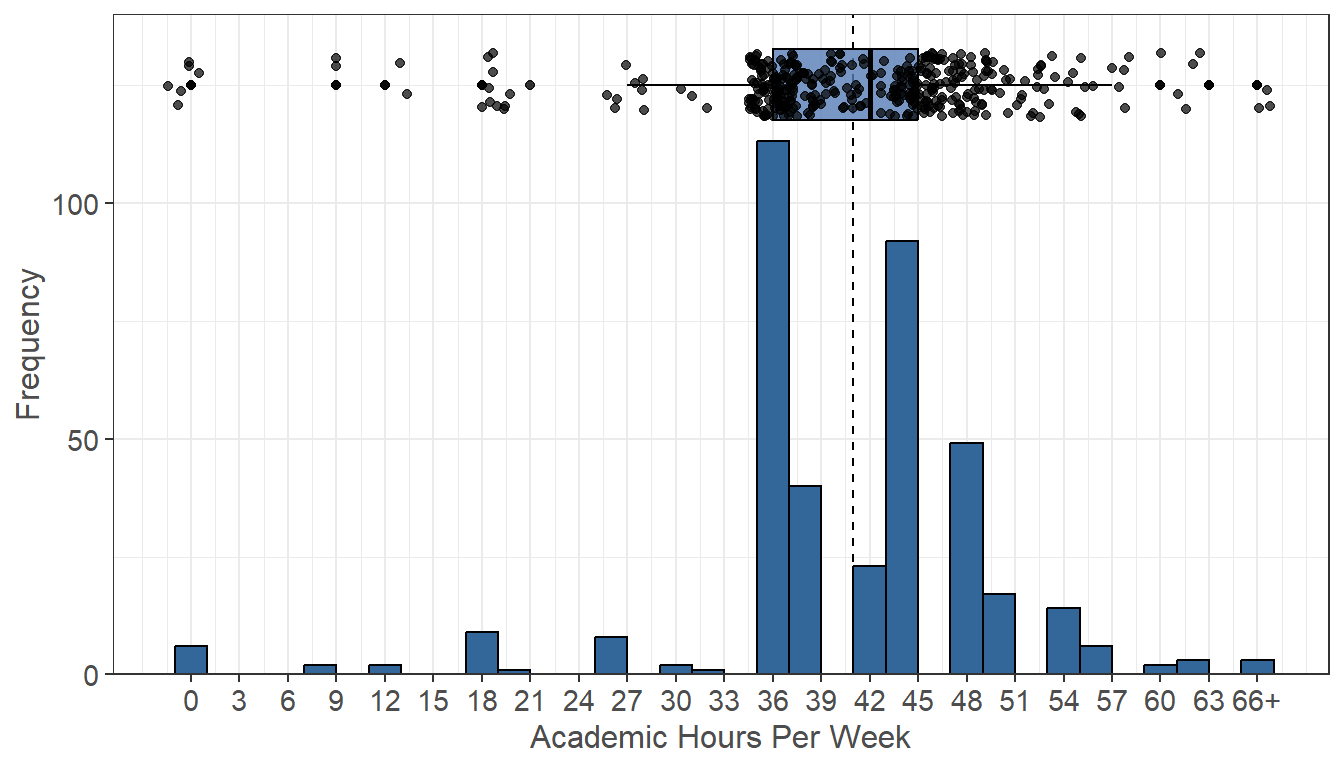 Figure 3.8: Academic Hours Distribution
The average number of academic hours worked per week (denoted by the dotted line) is 40.95, while the median is 42 hours. The majority of students do seem to be working 36 or more hours per week, with 36 hours being most common (113 people) and 45 hours following that (92 people).
Non-Academic Workload
Below is a combination of both paid and unpaid hours worked
by students to get a further understanding of the workload participants
face on a weekly basis. The values are also filtered so that only people
who worked (more than 0 hours in total) were included (n=282, 69% of 407
reporting). Note that values denoted as “41+” were added
together to form “82+”, but are rounded to 82 for the analysis
below.
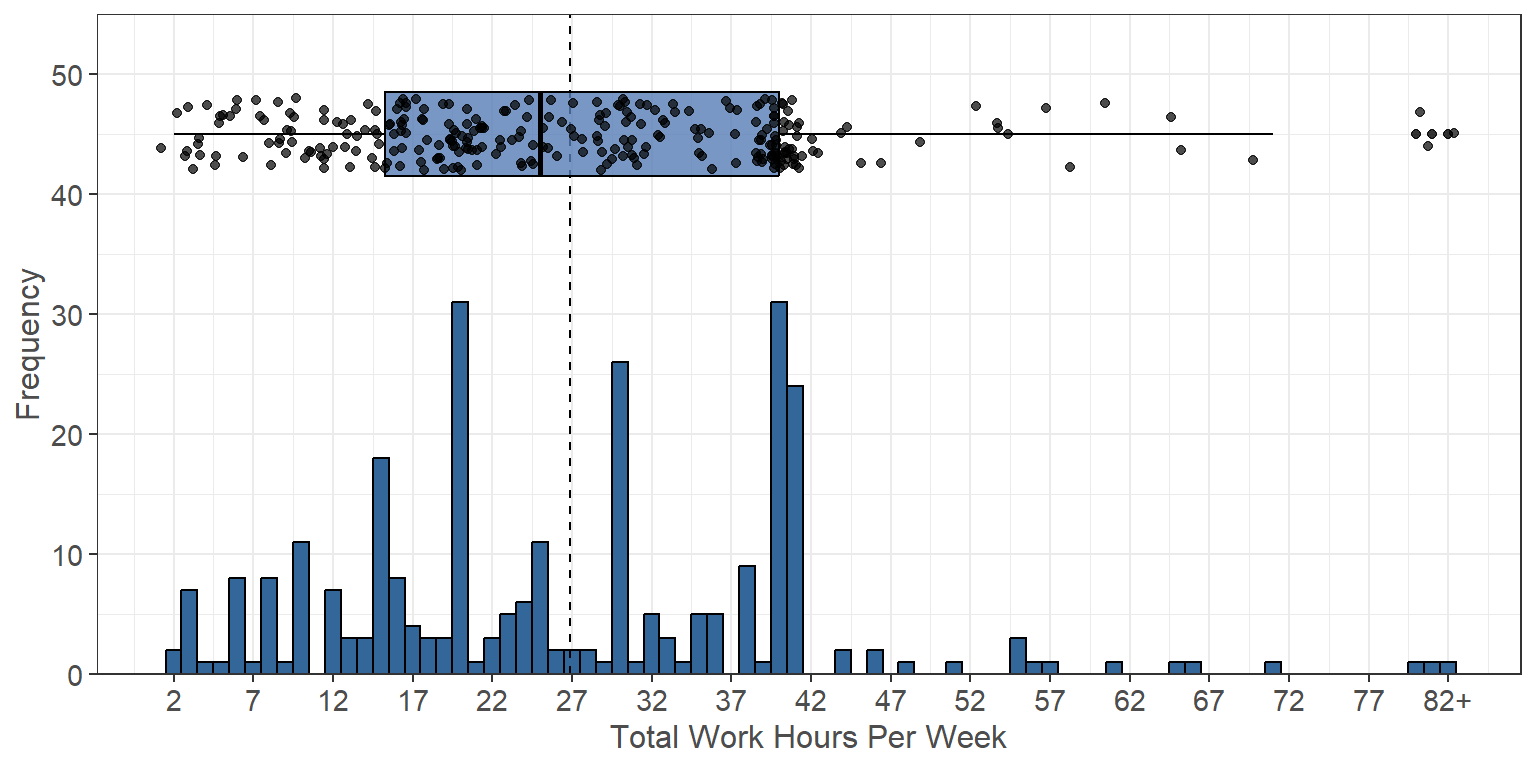 Figure 3.9: Non-Academic Hours Distribution
The average number of total hours worked per week (denoted by the dotted line) is 26.85, while the median is 25 hours. The majority of students do seem to be working under 40 hours per week in total, with 20 hours being most common (31 people) and 40 hours following that (31 people).
Total Workload
Below is a combination of all worked hours per week, both
academic and non-academic. This includes units (3 hr/unit), paid, and
unpaid worked hours (n=394, 97% of 407 reporting). Note
that values denoted as “41+” and “22+” were rounded to 41 and 22
(respectively) for the below analysis.
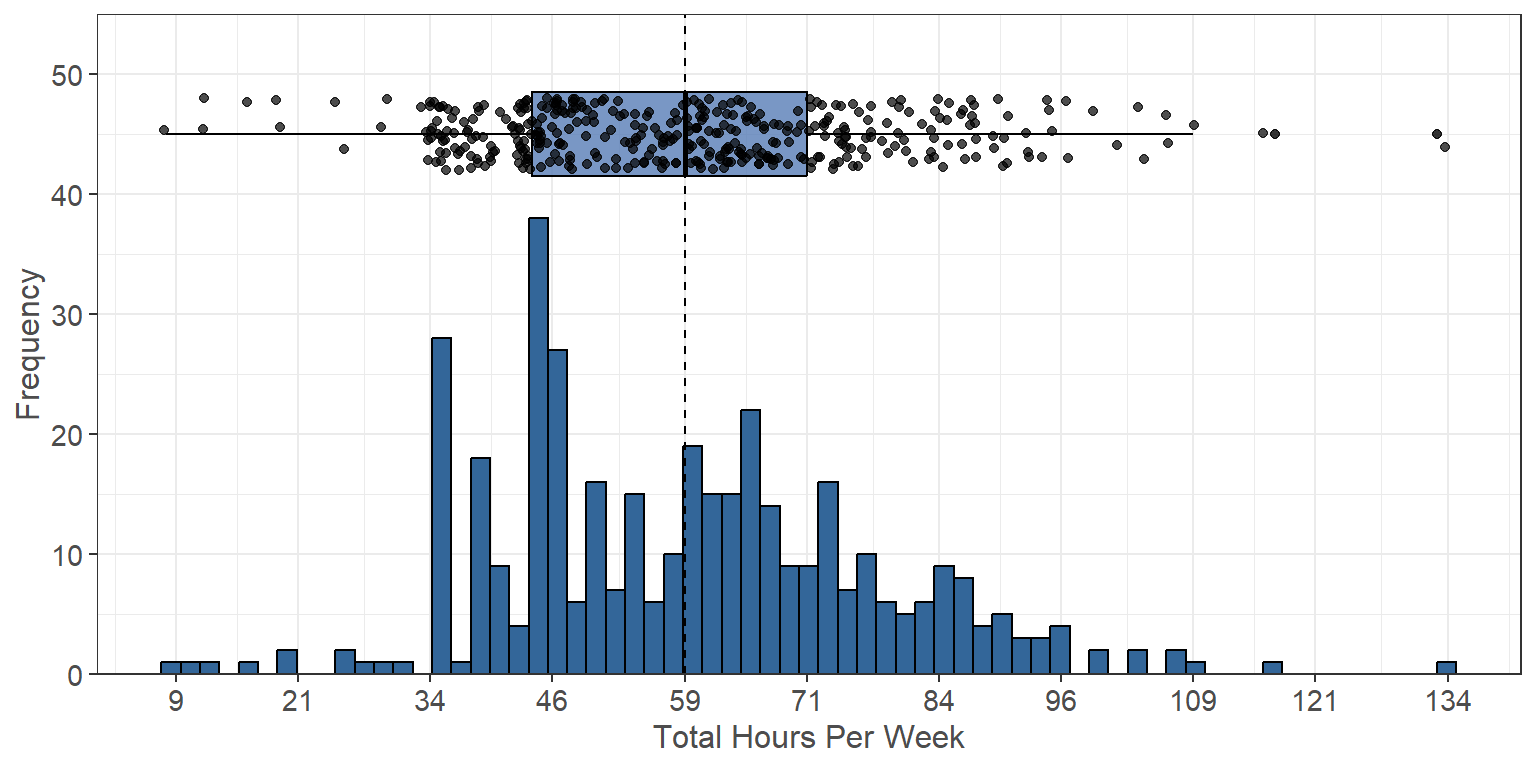 Figure 3.10: Total Workload Hours Distribution
The average number of total hours worked per week (denoted by the dotted line) is 60.06, while the median is 60 hours. The majority of students do seem to be working over full-time in total, with 45 hours being most common (35 people) and 36 hours following that (26 people).
CalFresh Workload
People are required to meet a certain work criteria in order to receive CalFresh benefits. All able-bodied adults are required to work a minimum of 80 hours per month, which can be broken down into roughly 20 hours per week. This can be either paid or unpaid work, and more information on this requirement can be found on the Department of Social Services website. If you are an student, you may be enrolled in at least 6 academic units or more (equivalent to 18+ hours per week of academic workload) rather than having a paid/unpaid job. For more information on student eligibility, see the College Student Eligibility requirements on Chico State’s website. Here you can use the COVID Prescreen template link to help determine if you will be eligible for CalFresh benefits.
The below graphs breaks down if a person meets the workload requirements based solely on one of the following criteria:
- Academic workload - enrolled in 6 or more units (18 or more hours).
- Paid Workload - working 20+ weekly hours at a paid position.
- Unpaid Workload - working 20+ weekly hours at a unpaid position.
- Total Workload - working 20+ weekly hours in total (combination of academic, paid, and unpaid).
Note: people with a workload of 0 hours were included in the
graph and analysis.
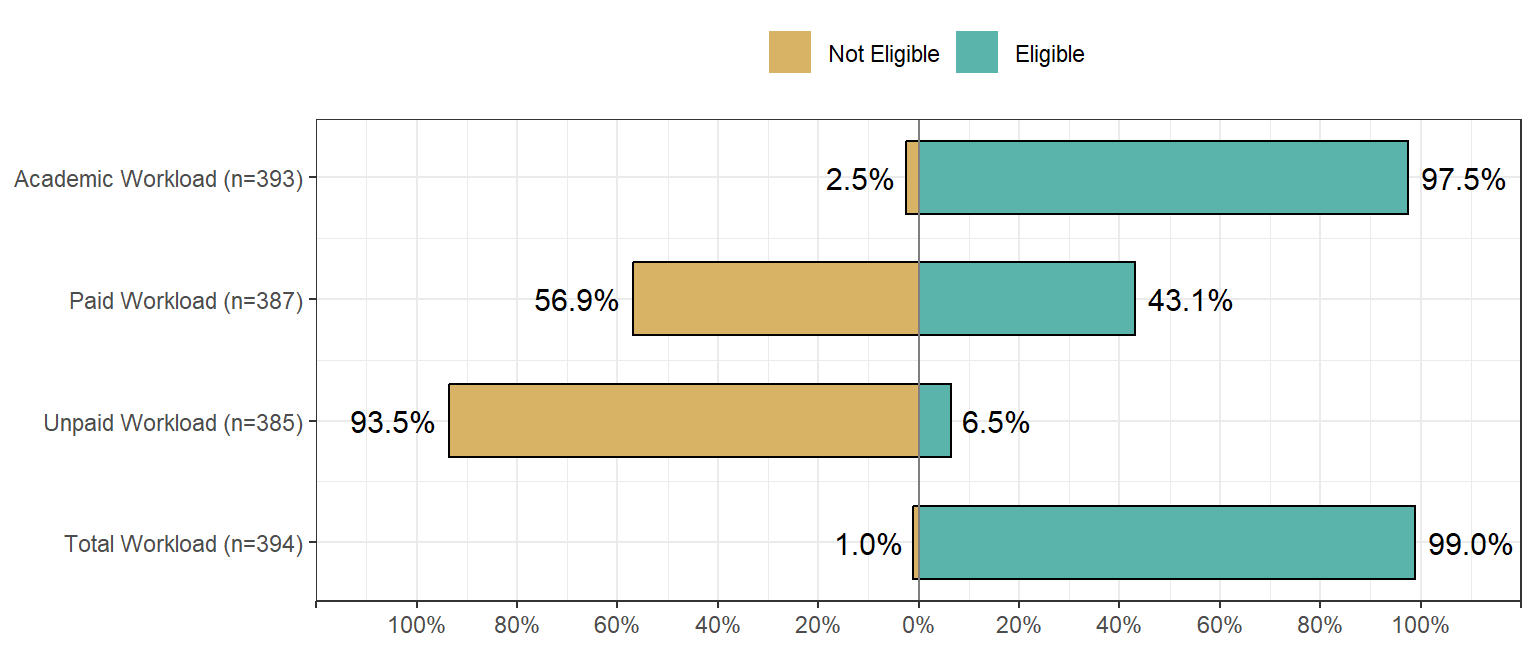 Figure 3.11: CalFresh Workload Qualification Breakdown
- Based on the academic workload, the data indicates a large majority of participants are taking more than 6 units and are meet the eligibility requirements (383 people). A very small minority of participants are not taking more than 6 units and do not meet the eligibility requirements (10 people). -Based on the paid workload, the data indicates that less than half of participants work 20 or more hours per week and meet the eligibility requirements (167 people). A little over half work less than 20 hours per week and do not meet the eligibility requirements (220 people).
- Based on the unpaid workload, the data indicates that only a minority of participants work 20 or more hours per week and meet the eligibility requirements (25 people). The vast majority work less than 20 hours per week and do not meet the eligibility requirements (360 people).
- Based on the total workload, the data indicates that the majority of participants work 20 or more hours per week and meet the eligibility requirements (390 people). Only a small number work less than 20 hours per week and do not meet the eligibility requirements (4 people).