Eating Habits
The following questions were asked in regard to students’ eating habits on a current, daily, and weekly basis. Students were asked how/if they prepare food at home, their daily consumption of fruits/vegetables and sugar, and their weekly habits of eating out and alcohol consumption. They were also asked about how confident they felt about buying/preparing healthy foods at home.
Current Eating/Cooking Habits
For each of the following statements, indicate how strongly
you agree or disagree about your current eating and cooking
habits:
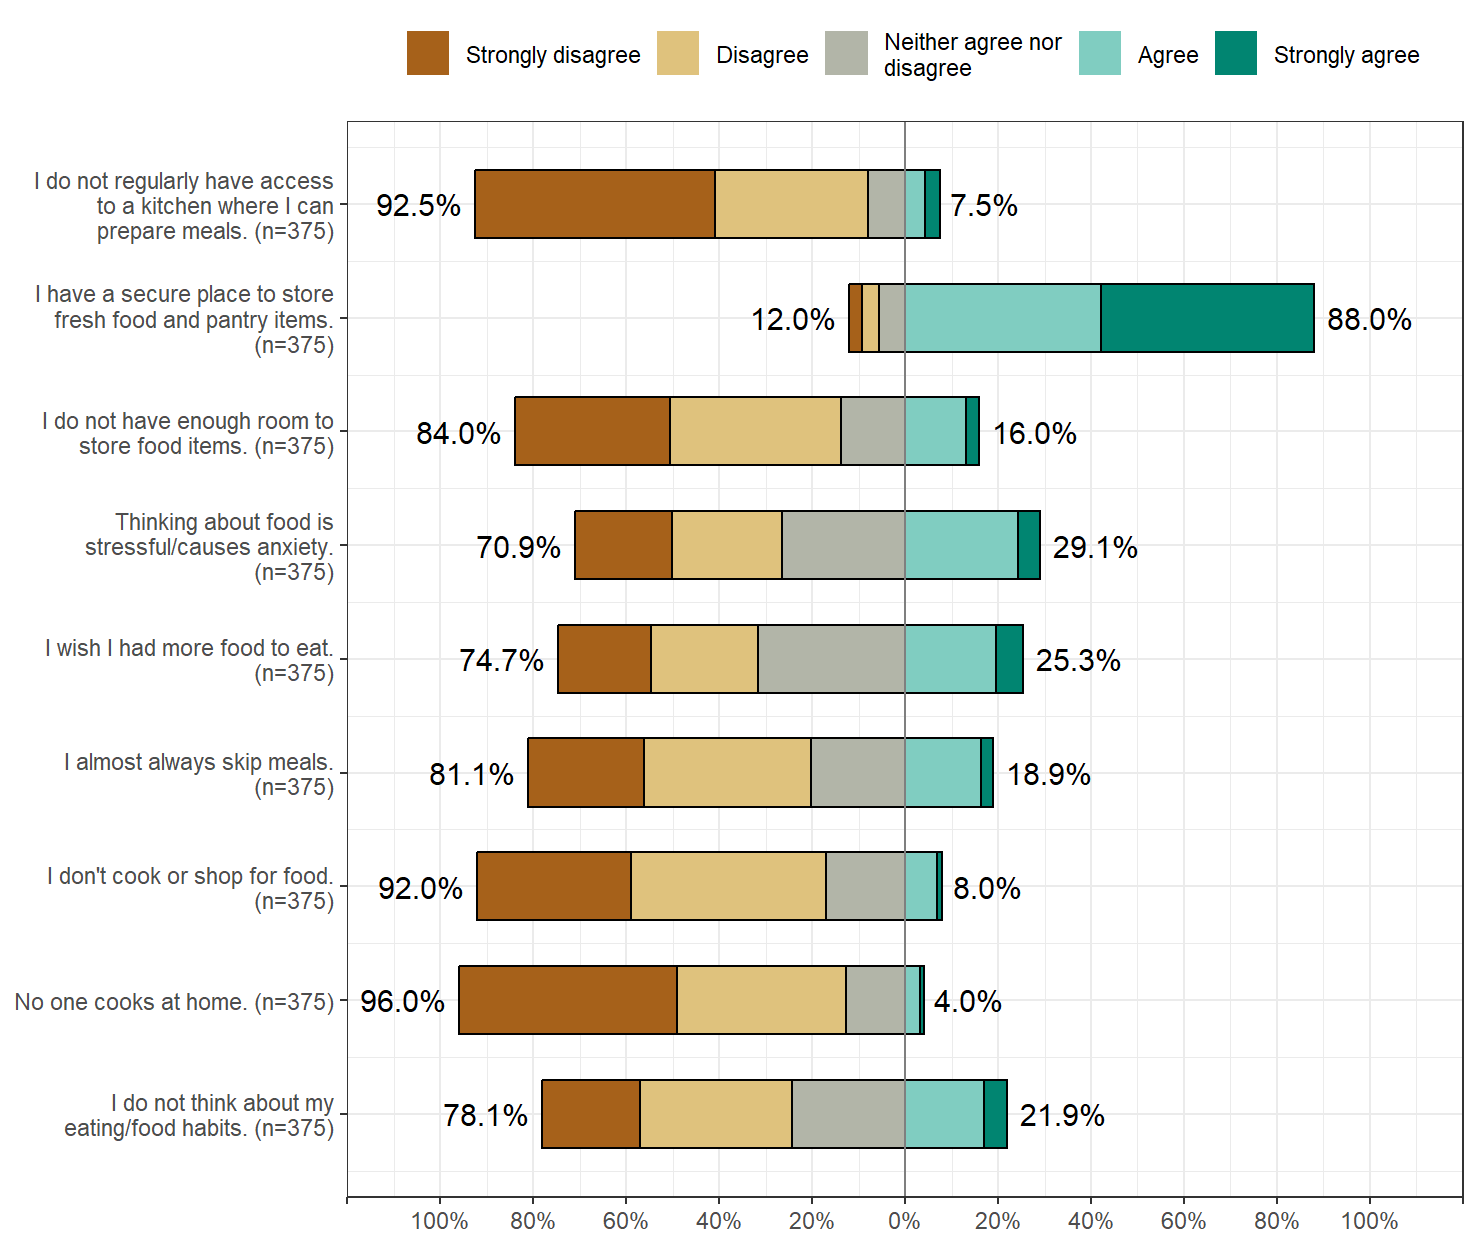 Figure 8.1: Current Eating and Cooking Habits
Daily Consumption
Fruits & Vegetables
How many servings of fruits and vegetables do you usually consume per day? (not including fruit juices) (n=342, 84% of 407 reporting).1
1 serving= 1 medium piece of fruit; 1/2 cup fresh, frozen, or canned fruits/vegetables; 1 cup salad greens; or 1/4 cup dried fruit.
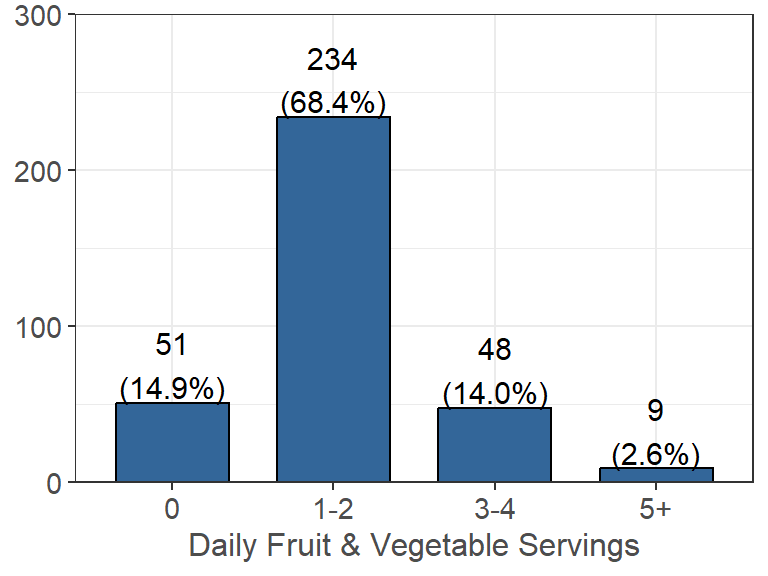
Figure 8.2: Daily Fruit & Vegetable Consumption
Looking at the daily consumption of fruits and vegetables, the majority of people claim to eat between 1-2 servings (234 people). 51 people claim to eat 0 servings, 48 people claim to eat 3-4 servings, and 9 people claim to eat 5+ servings.
Sugar/Energy Drinks
How many ounces of regular soda/cola/pop, sports drink, or
energy drinks do you consume each day? (n=363, 89% of 407
reporting).
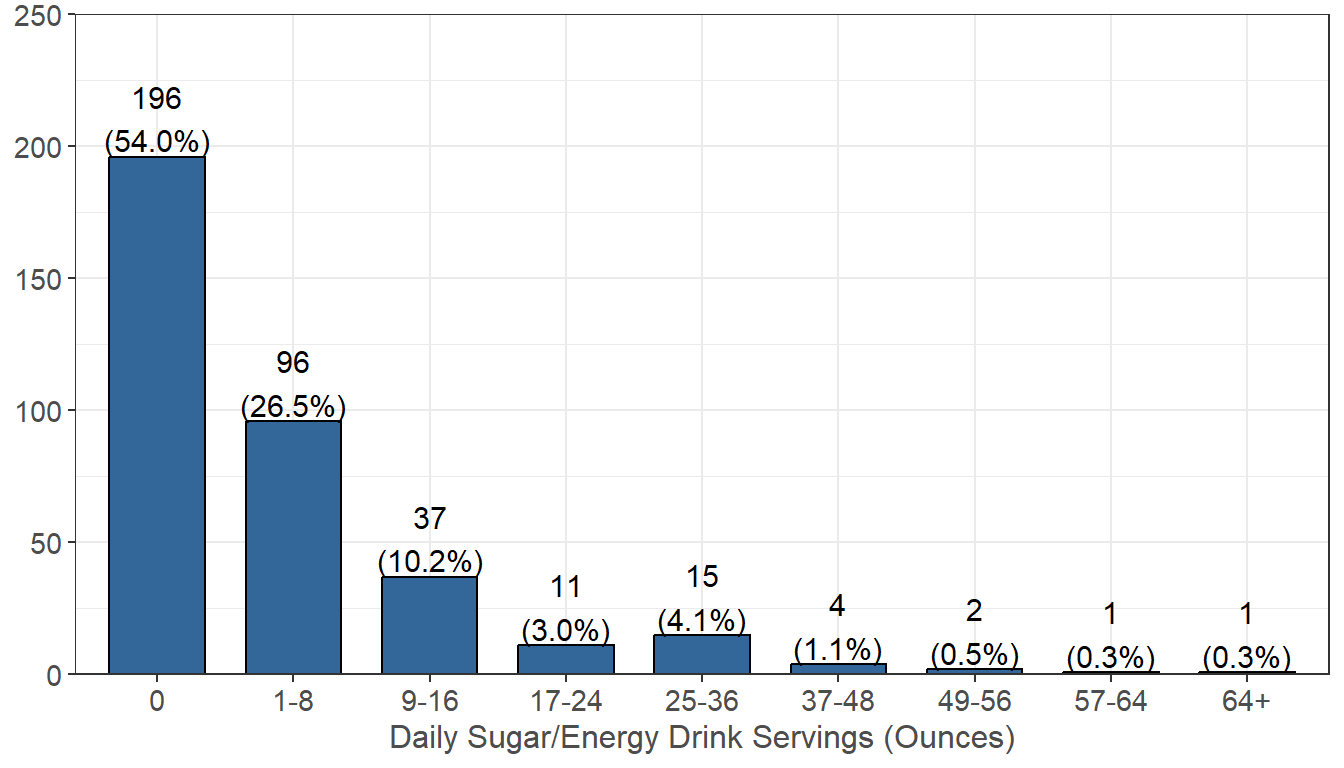 Figure 8.3: Daily Sugar/Energy Drink Consumption
Looking at daily consumption of regular soda/cola/pop, sports drink, or energy drinks the majority of people claim to drink 0 ounces (196 people). 96 people claim to drink between 1-8 ounces, 37 people claim to drink between 9-16, and only a small number of participants claim to drink 17 or more ounces per day.
Weekly Consumption
Eating Out
How frequently do you eat from fast food restaurants,
convenience stores, or vending machines for a meal or meal replacement?
(n=364, 89% of 407 reporting).
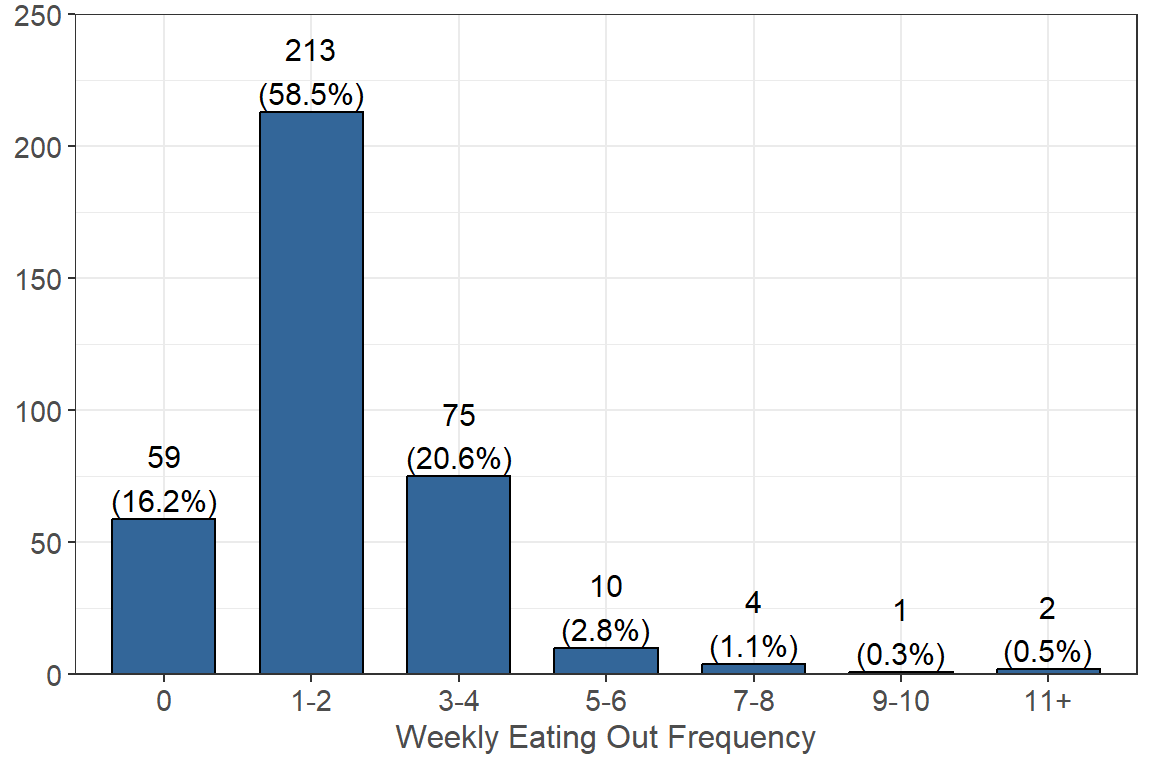 Figure 8.4: Weekly Eating Out Consumption
Looking at the weekly consumption of eating fast food, the majority of people claim to eat out 1-2 times per week (213 people). 75 people claim to eat out 3-4 times, 59 people claim to eat out 0 times, and only a small minority of people claim to eat out 5 or more times per week.
Alcohol Consumption
How often do you consume at least one serving of alcohol
(n=361, 89% of 407 reporting). If consumed, how many servings of alcohol
do you consume when you drink alcohol (n=93, 23% of 407
reporting).2
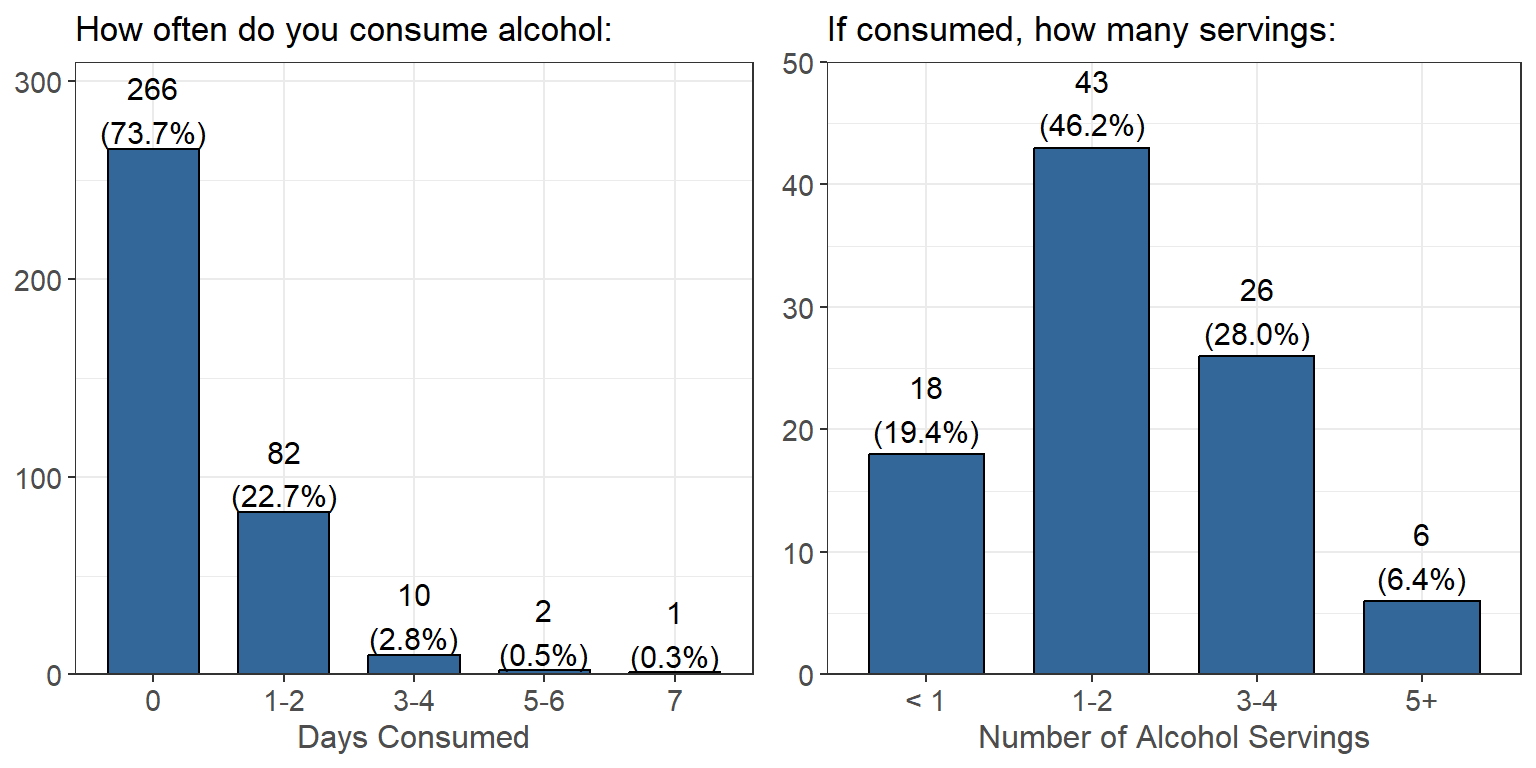 Figure 8.5: Weekly Alcohol Consumption - Days & Servings
Looking at the weekly alcohol consumption, the majority of people claim to consume alcohol 0 days per week (266 people). 82 people claim to drink 1-2 days per week. Only a small number of people claim to drink 3 or more days per week. Of the people who do consume alcohol, the majority consume 1-2 servings (43 people). 26 people claim to drink 3-4 servings, 18 people claim to drink < 1 servings, and only a small number drink 5 or more servings.
Food Comfort
The following questions pertain to how comfortable you feel
about buying or preparing food:3
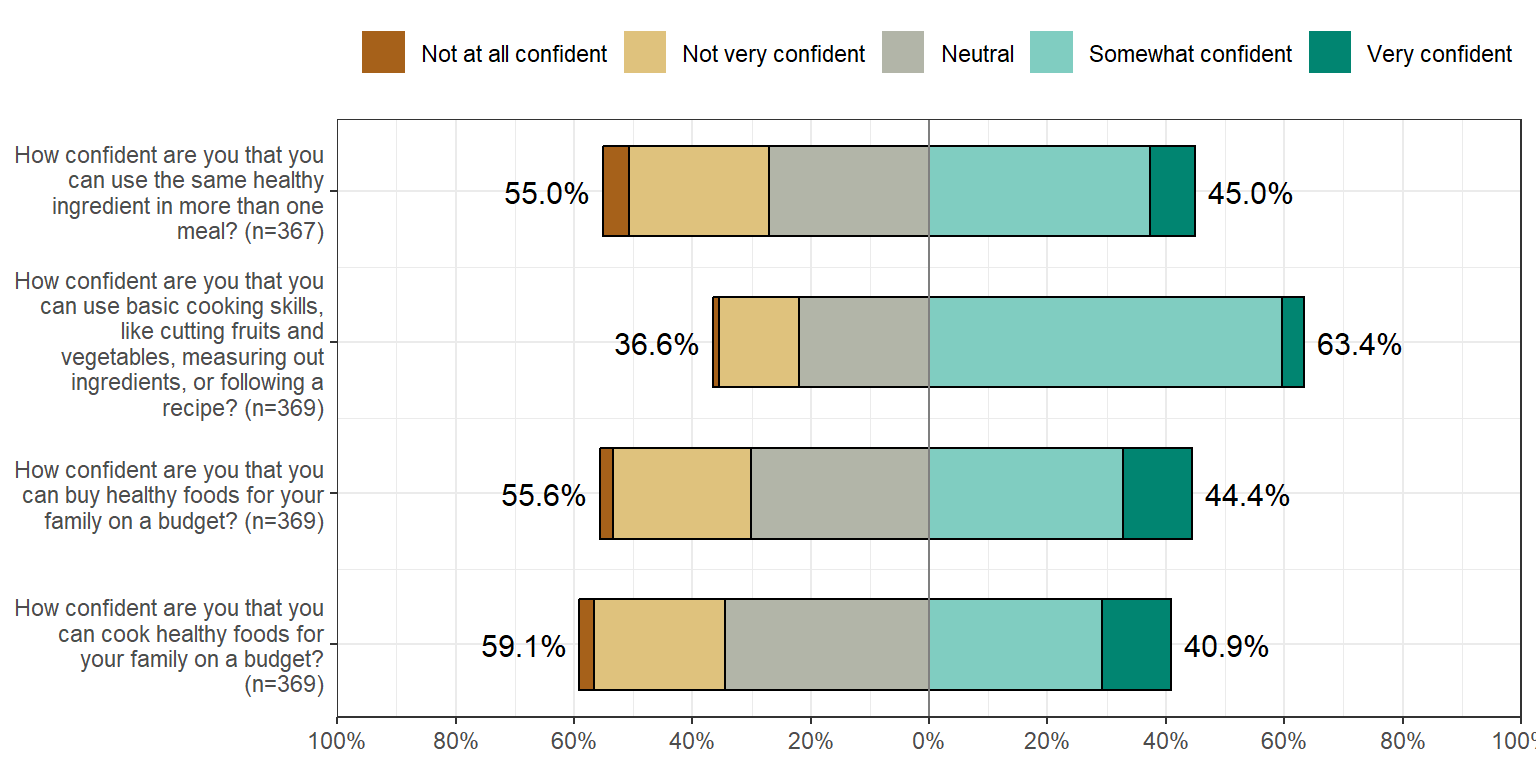 Figure 8.6: Buying/Preparing Food Comfort
Physical Activity
Click here to go to the Physical Activity page.
Mental Health
Click here to go to the Mental Health page.
Sleep
Click here to go to the Sleep page.
This question was developed by the American College Health Association’s (ACHA) National College Health Assessment (NCHA).↩︎
These questions were developed by the National Institute on Alcohol Abuse and Alcoholism (NIAAA) screening tool.↩︎
These questions were developed by the Share Our Strength’s Cooking Matters survey tool (a USDA-SNAP-Ed approved survey).↩︎