Housing
The following questions were asked in regards to students current and past housing situations, including changes due to COVID, if they are living near their college (with most schools being remote at the time of the survey), the type of home they current live in, and hardships that they faced in the past year with housing.
COVID Housing Impact
Has your housing situation changed due to COVID-19? (n=372, 91% of 407 reporting).
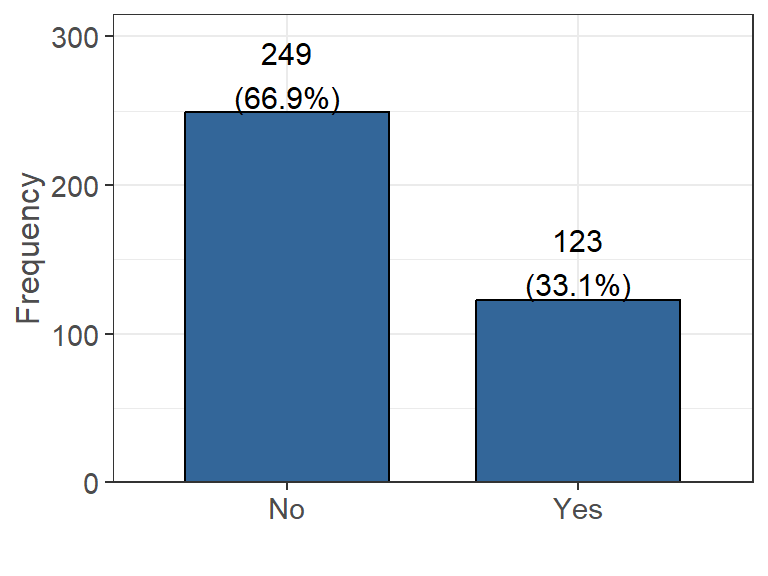
Figure 4.1: Impact of COVID on Housing
There are 249 people that participated in the survey that claim their housing has not changed due to the impacts of COVID. There are also 123 people that say their housing situation did change due to the impacts of COVID.
Living Near College
Are you currently living in the city/area in which you are enrolled in college? (n=387, 95% of 407 reporting).
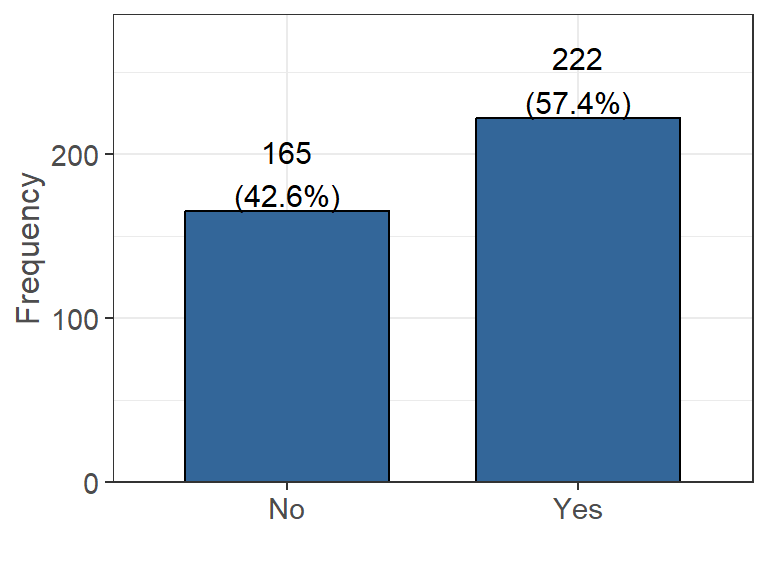
Figure 4.2: Living Near Enrolled College
There are 165 people that participated in the survey that do not currently live in the city/area of their enrolled college. There are also 222 people that say they do live in the city/area of their enrolled college. This high “No” value could likely be due to many campuses being remote and students choosing to live at home or in an area with a lower cost of living.
Current Housing Situation
Which best describes your current housing situation?| Current Housing Situation | Yes (%) |
|---|---|
| I live with parents or other relatives, not paying rent with my own money | 126/377 (33.4%) |
| I rent an apartment or house with roommates | 87/377 (23.1%) |
| I live with parents or other relatives, paying rent with my own money | 80/377 (21.2%) |
| I rent an apartment or house without roommates | 43/377 (11.4%) |
| I own my own home | 12/377 (3.2%) |
| I am temporarily living with friends or relatives, without permanent housing (couch surfing) | 9/377 (2.4%) |
| I live in university housing or residence halls | 9/377 (2.4%) |
| Other | 6/377 (1.6%) |
| I live in transitional housing or a halfway home | 2/377 (0.5%) |
| I am currently living at an outdoor location, abandoned building, car, or other area not meant for regular housing, without permanent housing | 2/377 (0.5%) |
| I live in a sorority or fraternity house | 1/377 (0.3%) |
In the past 12 months…
The following were asked as a series of Yes/No questions to help better understand the living situations of participating students.| Yes (%) | |
|---|---|
| Have you been unable to pay or underpaid a utility bill (n = 357)? | 119 (33.3%) |
| Was there a rent or mortgage increase that made it difficult to pay (n = 347)? | 115 (33.1%) |
| Have you ever been late paying rent or mortgage (n = 359)? | 93 (25.9%) |
| Have you been unable to pay or underpaid your rent or mortgage (n = 339)? | 89 (26.3%) |
| Have you lived with others beyond the expected capacity of your house or apartment (n = 358)? | 74 (20.7%) |
| Have you had to stay in a hostile housing environment or abusive relationship because you had no other place to live (n = 360)? | 32 (8.9%) |
| Have you been asked to leave your home by someone you lived with (n = 374)? | 22 (5.9%) |
| Have you been evicted (n = 379)? | 3 (0.8%) |
The following were asked as frequency questions to help better
understand the living situations of participating students.
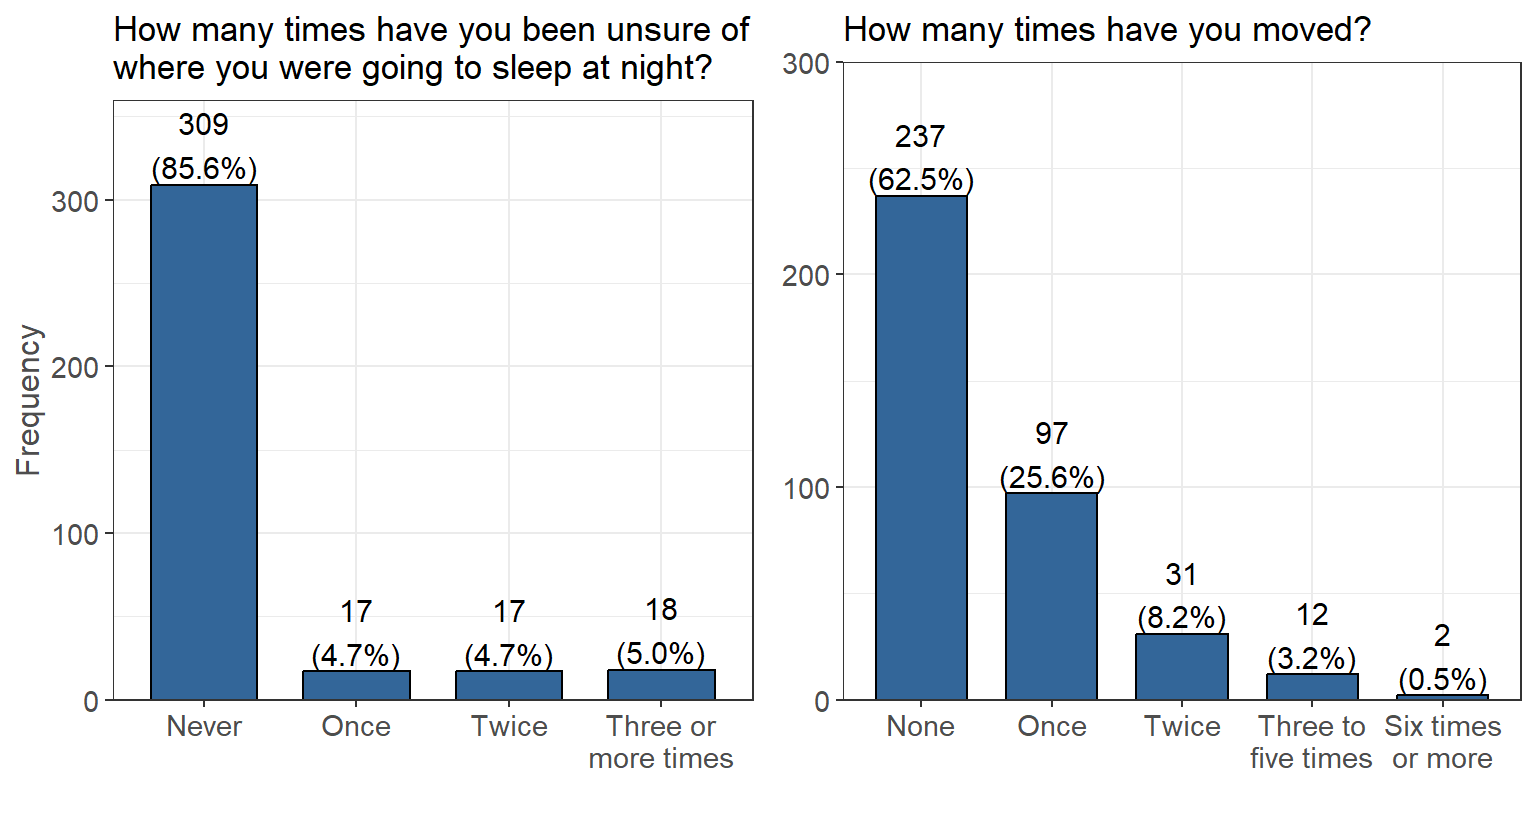 Figure 4.3: Unsure of Sleeping and Times Moved
Over the past 12 months, the majority of people were never unsure of where they would be sleeping (309 people ) or have not moved housing (237 people). For uncertainty in where they would be sleeping, the remaining responses were mostly evenly distributed over the other options. For number of times that a person has moved, 97 people have claimed they moved once in the last 12 months and 31 people have moved twice. Only a small minority have moved 3 or more times in the last 12 months.
Sleeping Places
In the last 30 days, or in the past 12 months, have you slept
in any of the following places?
Note: students were only allowed to chose either “last 30 days” or
“past 12 months”, so students who selected past 12 months are
interpreted as “over 30 days but less than 1 year”.
Stable
| Last 30 days | Last 12 months | |
|---|---|---|
| In a rented or owned house, mobile home, or apartment with my family (parent, guardian, relative or caretaker) | |80/382 (20.9%) | |135/382 (35.3%) |
| In a rented or owned house, mobile home, or apartment (alone or with roommates or friends) | |58/382 (15.2%) | |116/382 (30.4%) |
| Campus or University Housing | 7/382 (1.8%) | 21/382 (5.5%) |
| Sorority/Fraternity house | 0/382 (0.0%) | 3/382 (0.8%) |
Unstable
| Last 30 days | Last 12 months | |
|---|---|---|
| Temporarily staying with a relative, friend or couch surfing until I find other housing | 8/382 (2.1%) | 23/382 (6.0%) |
| In a car, truck, van, RV or camper | 6/382 (1.6%) | 9/382 (2.4%) |
| Temporarily at a hotel or motel without a permanent home to return to (not on vacation or business travel) | 2/382 (0.5%) | 6/382 (1.6%) |
| In a closed area/space with a roof not meant for human habitation such as an abandoned building, garage, tent, etc. | 0/382 (0.0%) | 4/382 (1.0%) |
| In a transitional housing or independent living program | 1/382 (0.3%) | 3/382 (0.8%) |
| Outdoor location such as street, sidewalk, alley, park, etc. | 1/382 (0.3%) | 3/382 (0.8%) |
| At a shelter | 1/382 (0.3%) | 2/382 (0.5%) |
| At a group home such as halfway house or residential program for mental health or substance abuse | 0/382 (0.0%) | 1/382 (0.3%) |
Unstable Housing
In the past 12 months, if you have experienced unstable
housing, what was the most common reason? (n=119, 29% of 407
reporting).
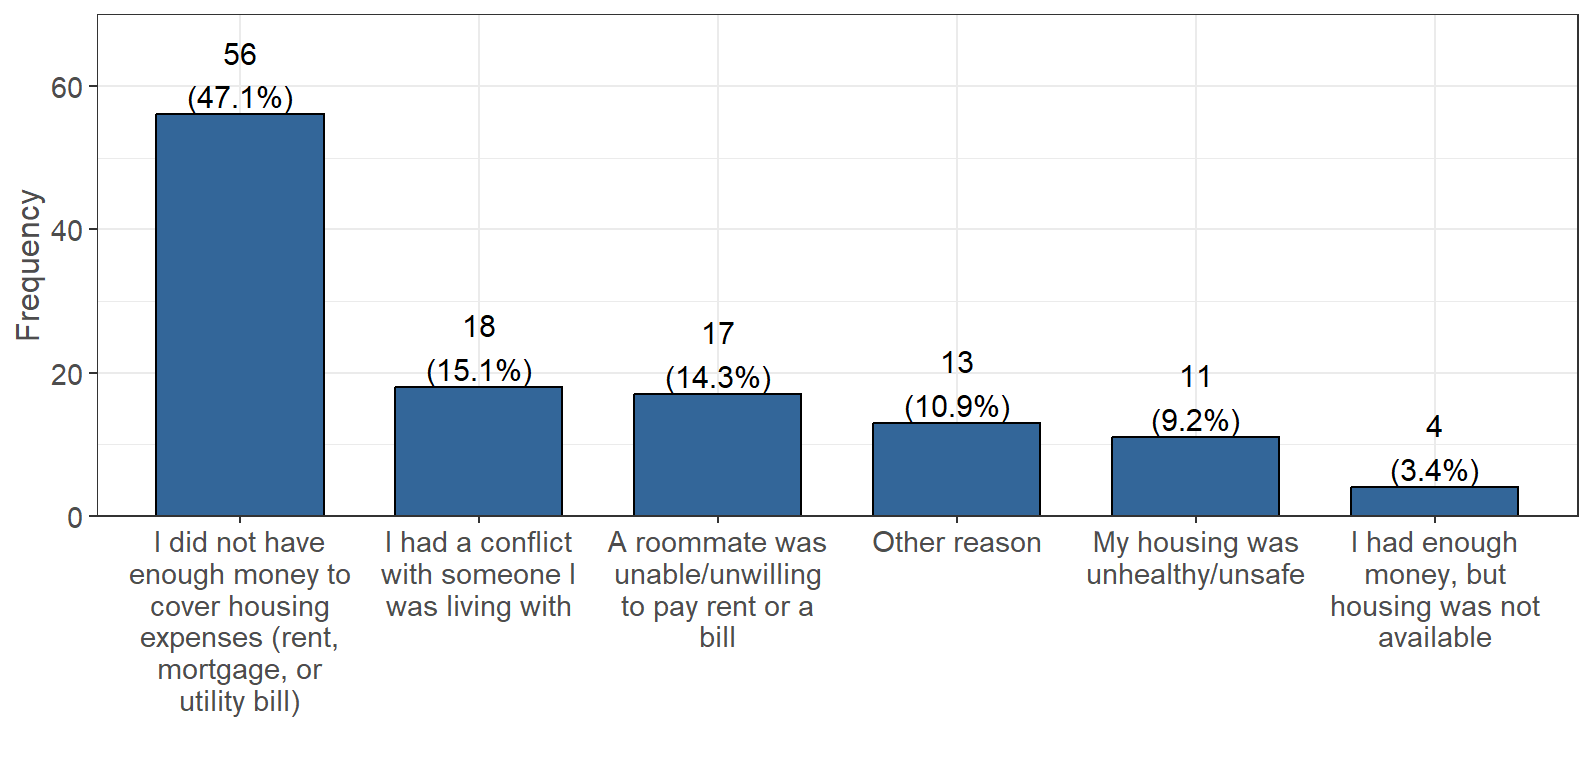 Figure 4.4: Unstable Housing Identification
The data shows that of the people who experienced unstable housing, the most common cause was not having enough money to cover housing expenses (56 people). The next most common cause was from issues with roommates, both having conflicts (18 people) and them being unable/unwilling to pay living expenses (17 people).
Housing Insecure & Homeless
- Students who answered Yes to 3 or more questions from the “In the past 12 months…” section above were deemed housing insecure (n=336, 83% of 407 reporting).
- Students who answered “last 30 days” and/or “last 12 months” in any question from the “Unstable” section above were deemed homeless in the past month or year (n=382, 94% of 407 reporting).
| Unstable Housing Type | Yes (%) |
|---|---|
| Housing Insecure | 27.1% |
| Homeless (year) | 12.0% |
| Homeless (month) | 3.4% |
The data indicates that the majority of students are not considered to be housing insecure (245 students, 72.9%), while the remaining students could be classified as housing insecure based on these indicators (91 students, 27.1%).
The data indicates that the majority of students did not experience homelessness in either the past month (369 students, 96.6%) or year (336 students, 88.0%).
🏫 📊 Campus Breakdown
Click here for campus breakdown of unstable housing.
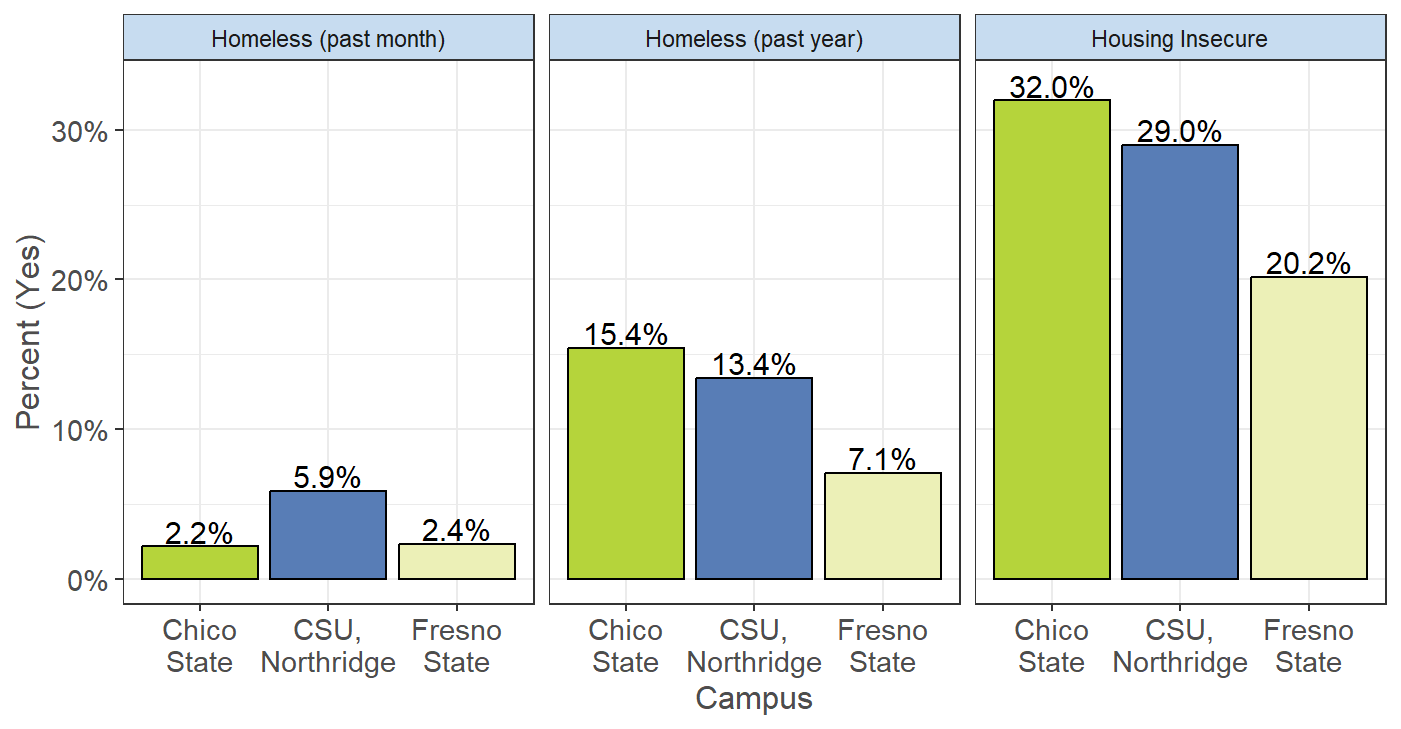 Figure 4.5: Unstable Housing by Campus
The majority of students have not experienced homelessness over the past month and are not housing insecure. However, there is a large increase in homelessness over the past year compared to the past month for Chico State students and around a 2 times increase for both Fresno and Northridge. Around 1 out of 3 students at Chico and Northridge and around 1 out of 5 students at Fresno are identified as housing insecure.