Personal Demographics
The following set of questions were asked in regard to the students’ personal demographics. Questions include the students’ age at the time of the survey (2020), ethnicities they identify as, and the number of dependents they are responsible for taking care of. They were also asked about their parents’ education, which will help us identify first generation college students.
Age
The following was determined by taking the difference between
birth date and the time at which the survey was completed (n=137, 100%
of 137 reporting).
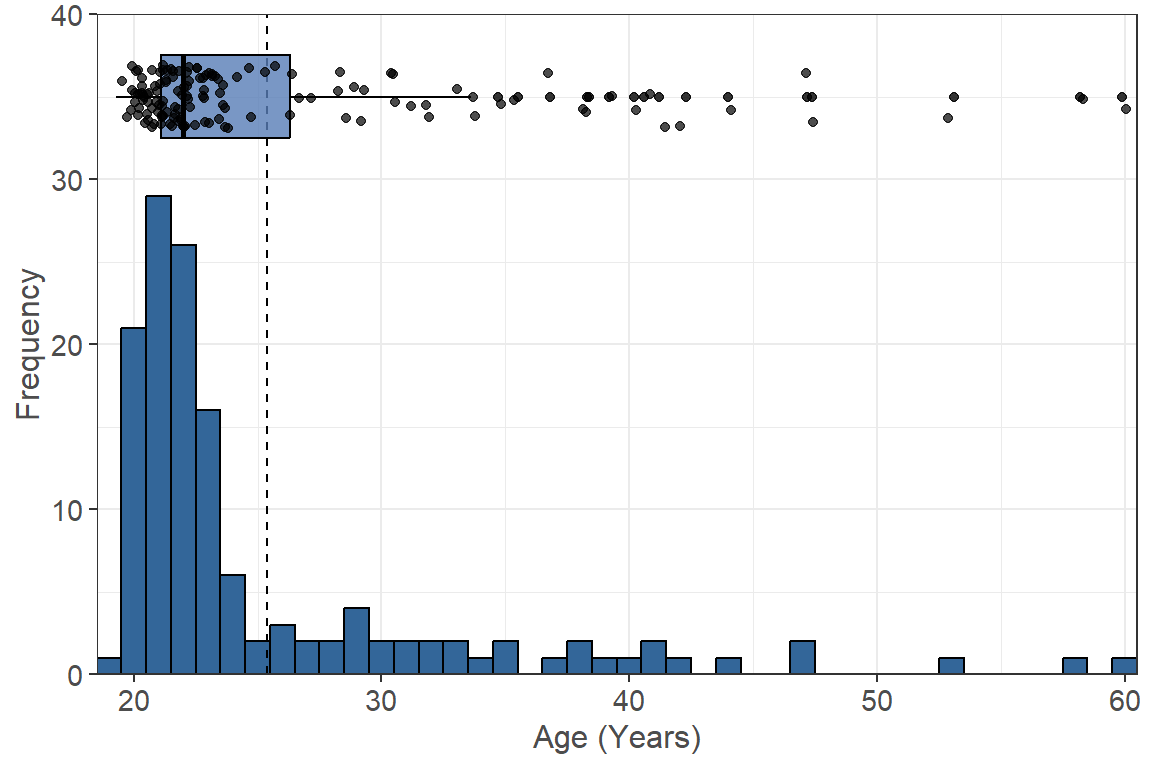 Figure 1.1: Student Age Distribution
The age of the participants in the survey range from 19.3 to 59.9 at the time of completion, with the majority of participants being between 20-30 years old. The average age of a participant in this survey is 25.4 years old.
Gender Identity
What is your gender identity? (n=136, 99% of 137 reporting).

Figure 1.2: Student Gender Identity
Of the survey participants, 84 of them identify as a woman and 52 identify as a man. There are also 2 survey participants who preferred not to answer this question.
Ethnicity
In the US Census, Hispanic Origins are not races. Do you identify as Hispanic or Latino or Spanish Origin? (n=135, 99% of 137 reporting).

Figure 1.3: Hispanic Origin Identification
The Basic Needs Survey defines Hispanic Origin to include: Mexican, Mexican American, Chicano, Puerto Rican, or another Hispanic/Latino/Spanish origin. The data indicates that the majority of survey participants identify as of Hispanic Origins (98 people), while approximately a quarter of them do not identify as being of Hispanic Origins (37 people).
Race
What race do you identify as? Select all that apply (n=137, 100% of 137 reporting). Note that races were collapsed from an original 14 options down to 5 broad groups defined by census.gov.
Table 1.1: Student Race Identification| Yes (%) | |
|---|---|
| Black or African American | 98 (72.6%) |
| American Indian and Alaska Native | 57 (42.2%) |
| White | 42 (31.1%) |
| Native Hawaiian and Other Pacific Islander | 6 (4.4%) |
| Asian | 5 (3.7%) |
Dependents
If you have dependents, then how many of them receive more
than 50% of their financial support from you? (n=132, 96% of 137
reporting).
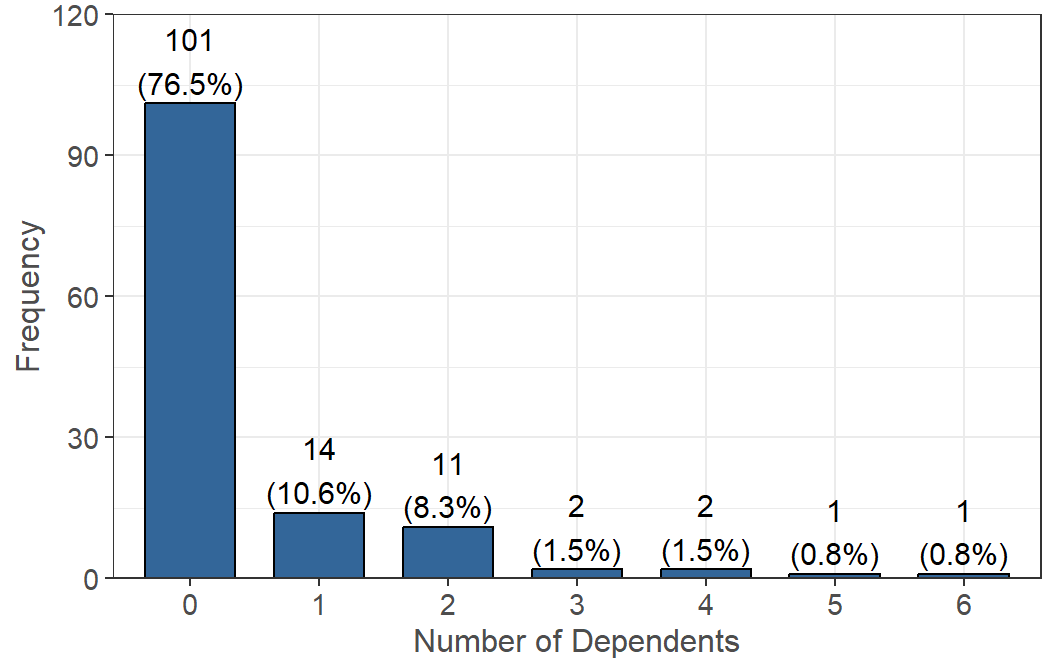 Figure 1.4: Number of Dependents
The majority of survey participants claim to have 0 dependents (101 people), 14 survey participants claim to have only 1 dependent, and only 17 claim to have 2 or more dependents.
Dependent Ages
What is/are the age(s) of these dependent(s)?
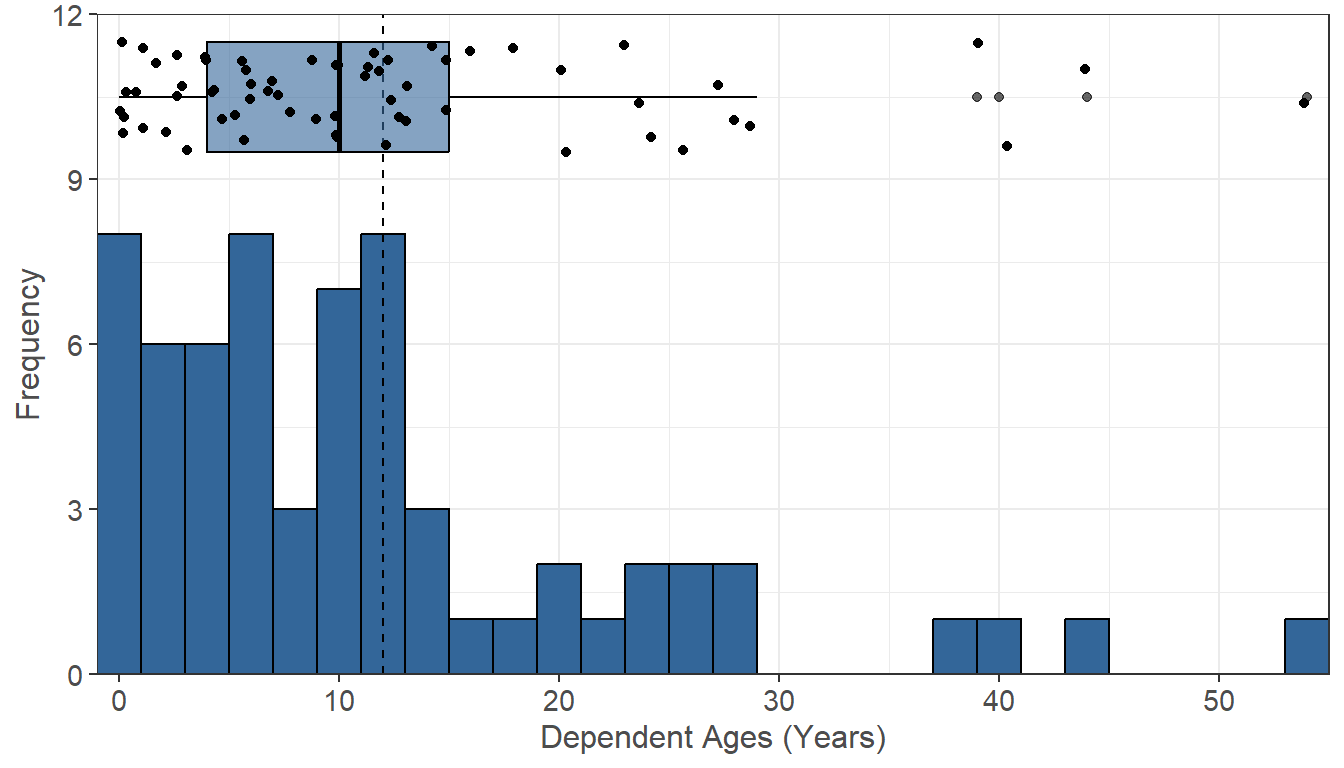 Figure 1.5: Dependent Age Distribution
From figure 1.5, the data indicates that the majority of dependents are under the age of 18. The ages of these dependents range from 0 to 54 with a standard deviation of 11.38. The average age of a dependent is 12.02 while the median age is 10. The most common dependent age is 0 years old, with 5 survey participants having dependents of this age.
Parents Education
What is the highest level of education completed by your
parents/guardians? (n=134, 98% of 137 reporting).
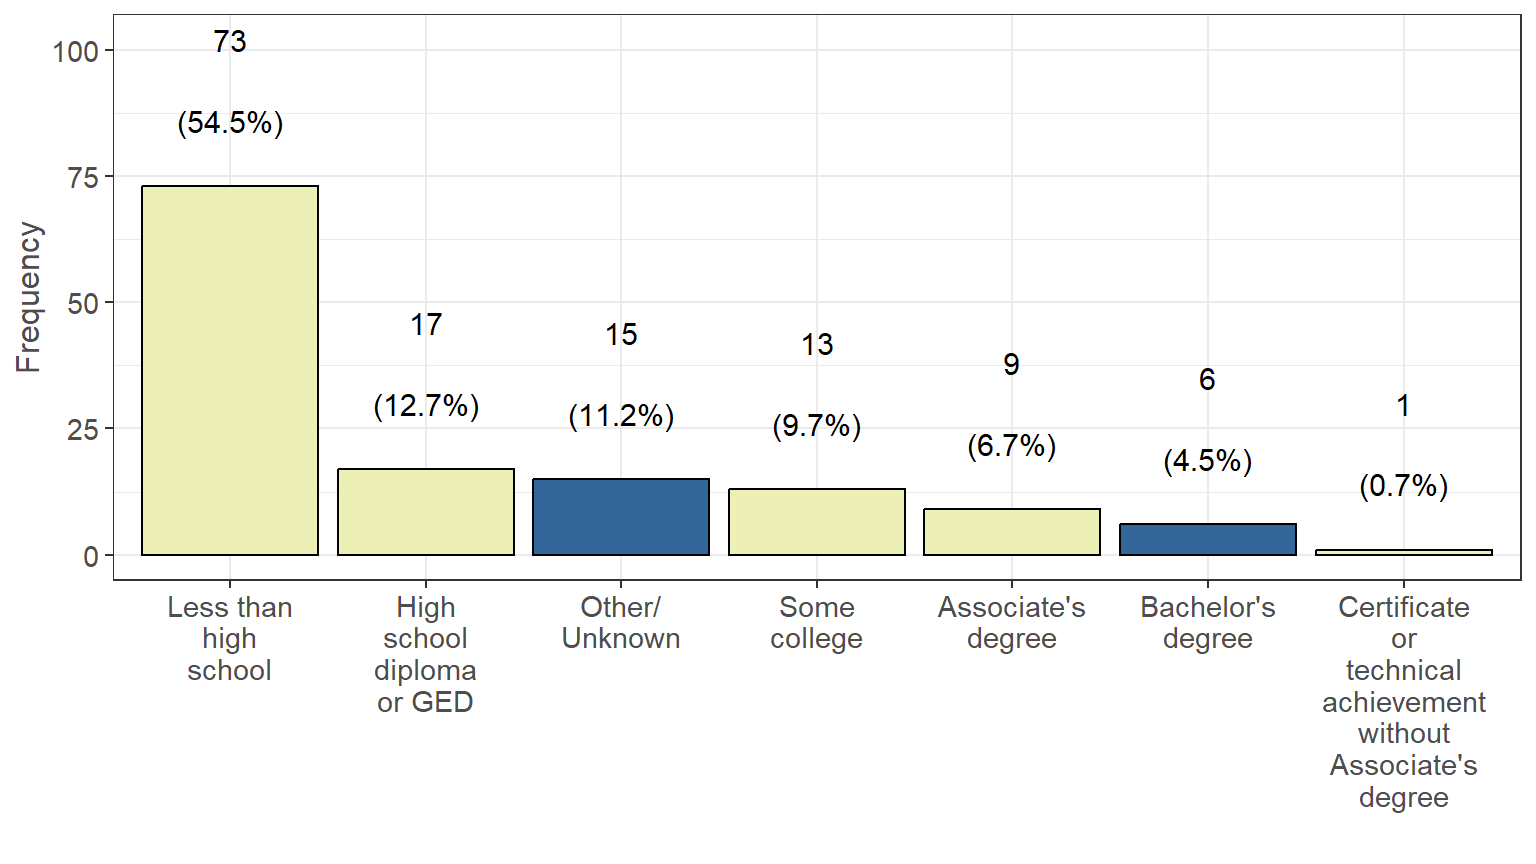 Figure 1.6: Parents Highest Education
Note: Variables filled with yellow above are used to show the conditions used to build the First Generation variable–see figure 1.7 for further information.
The highest level of education completed by most of the survey participants’ parents is “Less than high school” (73 people), 17 survey participants claim their parents’ highest level is “High school diploma or GED”, and 15 claim their parents’ highest level is “Other/Unknown”. Only a minority of the participants have parents who have some type of college level degree.
First Generation
Note: students with parents’ education identified as “Other/Unknown” were not marked as first gen since they could not be determined. (n=119, 87% of 137 reporting).
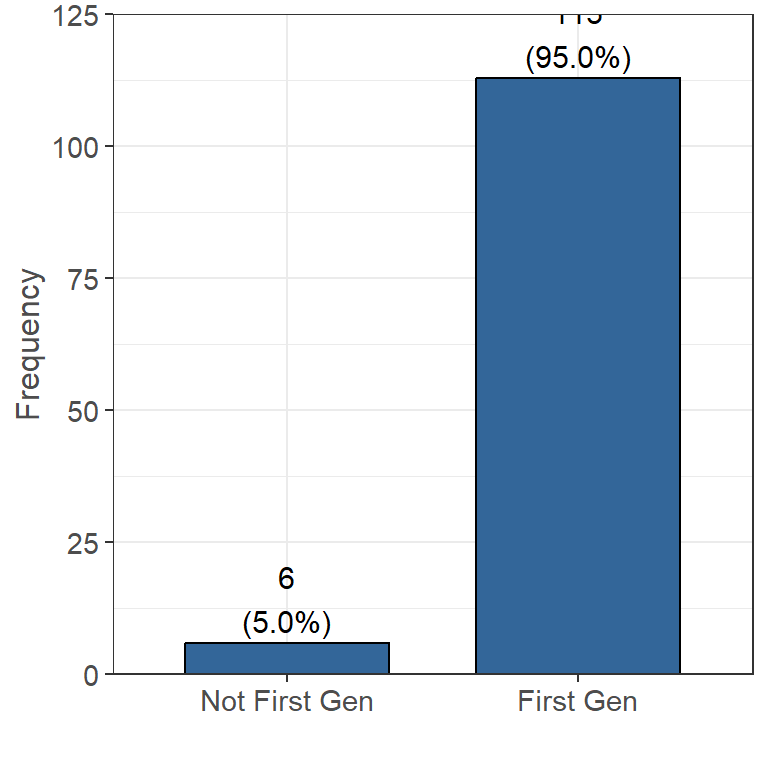
Figure 1.7: First Generation College Students
Figure 1.7, shows that 113 survey participants are considered First Generation College students and 6 survey participants are not considered First Generation College students.
As defined by the University of California, we define first generation students as “working to be part of the first generation in their families to earn a four-year university degree”. As such, students in the data set are considered first generation if their parents do not have a Bachelor’s or Master’s degree from a four-year university. From the Parents Education graph (figure 1.6), all bars highlighted yellow are considered first gen, while all bars in blue are not (excluding Other/Unknown).
Student Demographics
Click here to go to the Student Demographics page.