Student Demographics
The following set of questions were asked in regard to the students’ academic demographics. This includes information such as their class standing, major, GPA, and number of enrolled units. They were also asked questions about programs they participate in as well as what type of student they are (transfer, international, etc.) to help identify students.
Class Standing
Estimate your class standing by units completed (n=119, 97% of 123 reporting).

Figure 2.1: Current Academic Level
The survey was distributed to all junior and senior undergraduate students who met the EOP eligibility requirement. Out of the 119 respondents, 76 (63.9%) reported being seniors
Major
What is your major? (n=122, 99% of 123 reporting).
 Figure 2.2: Declaration of Major
NOTE: Science, Technology, Engineering and Math (STEM) was shortened for the figure above, but also includes the following majors: Medicine, Computer Science, Agriculture, Accounting, Statistics, Nursing, and Nutrition.
The majority of students in the data are majoring in a Public Health, Social Services, Social Science, Education program (46 people). There were 35 students who were Science, Technology, Engineering and Math (STEM) majors. Students were also given the option of “Other” to fill in a major if it did not fall into one of the above categories. There were 10 out of 13 respondents who specified their “Other” major, with results shown in Table 2.1 below.
Other Majors
Table 2.1: Other Major Declarations| Other Majors | Occurrence (%) |
|---|---|
| Deaf Studies | 2/10 (20.0%) |
| Criminology | 2/10 (20.0%) |
| Journalism | 2/10 (20.0%) |
| Human and Behavioral Science | 1/10 (10.0%) |
| Marketing | 1/10 (10.0%) |
| Film Production | 1/10 (10.0%) |
| TV Production | 1/10 (10.0%) |
Overall GPA
What is your approximate overall grade point average (GPA)? (n=122, 99% of 123 reporting).
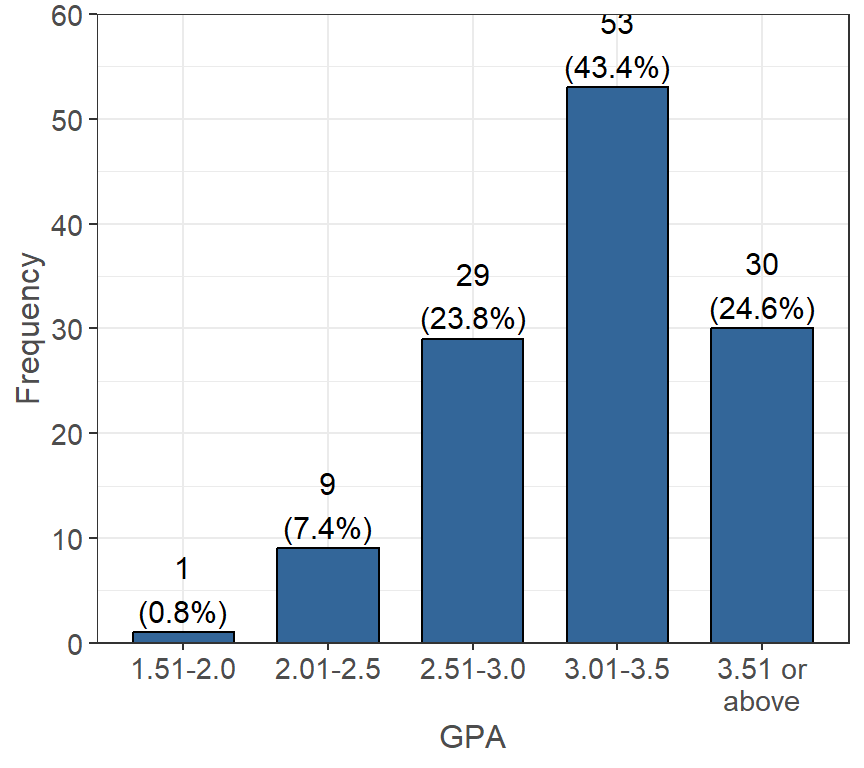
Figure 2.3: Approximate Overall GPA
The highest frequency overall GPA for the data ranges between 3.01-3.5 (53 students), followed by 3.51 or above (30 students). There are also 29 students who have an overall GPA between 2.51-3.0.
Currently Enrolled Units
How many units are you currently taking? (n=120, 98% of 123
reporting).
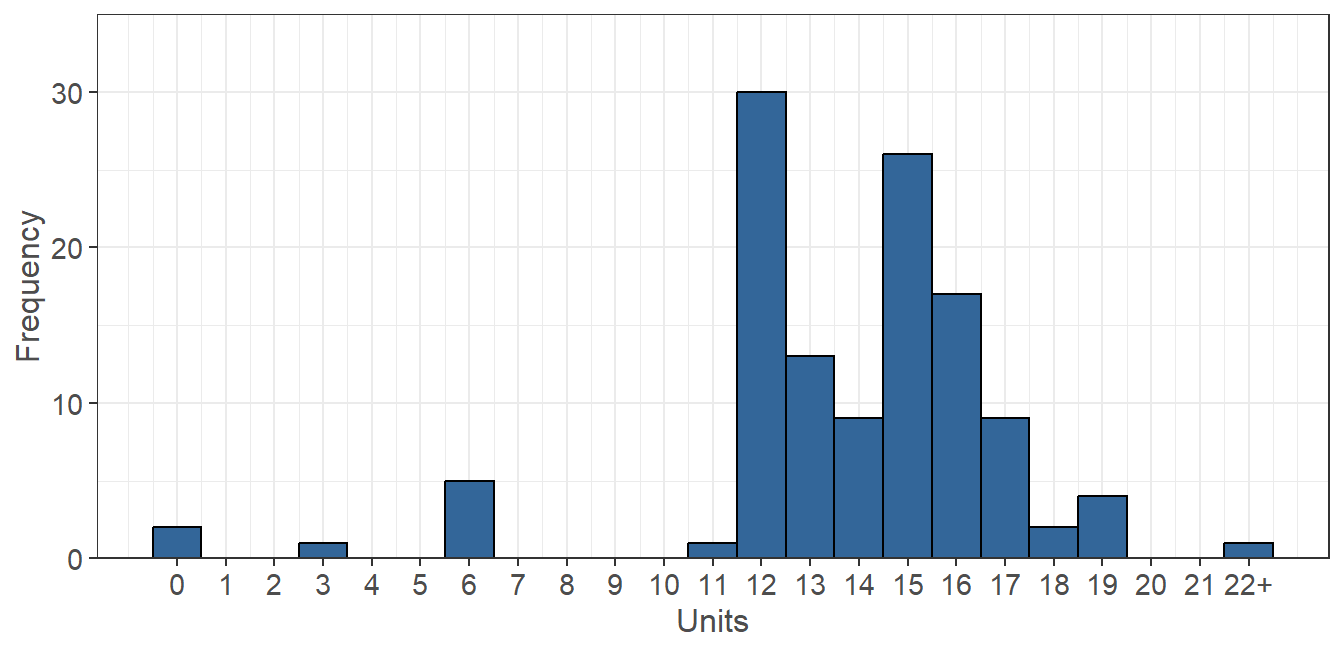 Figure 2.4: Currently Enrolled Academic Units
Note that “22+” was rounded to 22 in the following analysis for the currently enrolled number of units.
The average number of units that a survey participant in this data is enrolled in is 13.73 units, while the median is 14 units. The data indicates 111 students are considered full-time (12 or more units), with 12 units being the highest occurring and 15 units being the second highest occurring.
Student Identifiers
The following tables contain separate questions that were asked as a series of Yes/No responses to help further understand students.
I identify as…
| Yes (%) | |
|---|---|
| An EOP (Educational Opportunity Program) student (n = 122). | 122 (100.0%) |
| A Transfer Student (n = 122). | 47 (38.5%) |
| An ESL (English as a Second Language) student (n = 117). | 24 (20.5%) |
| LGBTQA+ (n = 119). | 19 (16.0%) |
| An Upward Bound, Educational Talent Search, AVID, TRIO, or other college preparation program alumni student (n = 112). | 15 (13.4%) |
| A student with a disability (n = 118). | 14 (11.9%) |
| A former foster youth/child (n = 122). | 12 (9.8%) |
| A student athlete (n = 121). | 5 (4.1%) |
| A DREAM (i.e. undocumented) student (n = 122). | 4 (3.3%) |
| A non-California resident (not International) (n = 121). | 3 (2.5%) |
| A DACA (i.e. Deferred Action for Childhood Arrivals) student (n = 122). | 3 (2.5%) |
| A Veteran of military service (n = 122). | 2 (1.6%) |
| An International student (n = 122). | 0 (0.0%) |
Disability Support Services
Note: This name varies by campus and may not always be called the Disability Support Service Center. The \(n\) reported is the number of respondents who answered each question. Disagreement indicates that not all students answered both questions.
| Yes (%) | |
|---|---|
| I have NOT received services through the Disability Support Services Center (n = 114). | 53 (46.5%) |
| I receive services through the Disability Support Services Center (n = 121). | 12 (9.9%) |
I participate in…
| Yes (%) | |
|---|---|
| CalWorks (i.e. TANF or cash aid for needy families) or Aid to Families with Dependent Children (AFDC) (n = 113). | 18 (15.9%) |
| The Greek system (i.e. sorority, fraternity) (n = 119). | 8 (6.7%) |
| The CalFresh Employment or Training (CFET) Program (n = 115). | 7 (6.1%) |
| The Job Opportunities and Basic Skills (JOBS) program (n = 112). | 3 (2.7%) |
I am…
| Yes (%) | |
|---|---|
| Currently a Pell Grant recipient (n = 103). | 84 (81.6%) |
| Approved, awarded, or accepted for work study (with or without a work study job) (n = 106). | 56 (52.8%) |
| Enrolled in a program that increases employability for current and former foster youth (PATH Scholars, Educational Opportunity Resilient Scholars Program (RSP), Renaissance Scholars Program) (n = 115). | 13 (11.3%) |
| A single parent of a dependent household member under the age of 12 (n = 121). | 13 (10.7%) |
| The parent/guardian of a dependent household member between the age of 6 and 12 with no adequate childcare (n = 120). | 10 (8.3%) |
| Enrolled in the Mathematics, Engineering, Science achievement (MESA) program (n = 117). | 5 (4.3%) |
| Enrolled in Workforce Innovation and Opportunity Act (WIOA) (n = 117). | 0 (0.0%) |
| Enrolled in a Teaching Credential Program (n = 0). | 0 (NA) |
| Enrolled in the School of Social Work Practicum Program (Field work program) (n = 0). | 0 (NA) |
Personal Demographics
Click here to go to the Personal Demographics page.