Academic Profile
Students were asked to report information relating to their academics. This includes information such as what college they were currently enrolled in, their class standing, major, GPA, and enrolled units. They were also asked questions about programs they participate in as well as what type of students they identify as (transfer, international, etc.).
As a reminder, students had the option to select “Prefer not to answer” for all questions, and these responses were set as missing values. In addition, 11 (6.0%) students did not finish the survey. The n reporting refers to the total number of non-missing responses, while the percent reporting reflects the percent of non-missing responses.
Academic Level
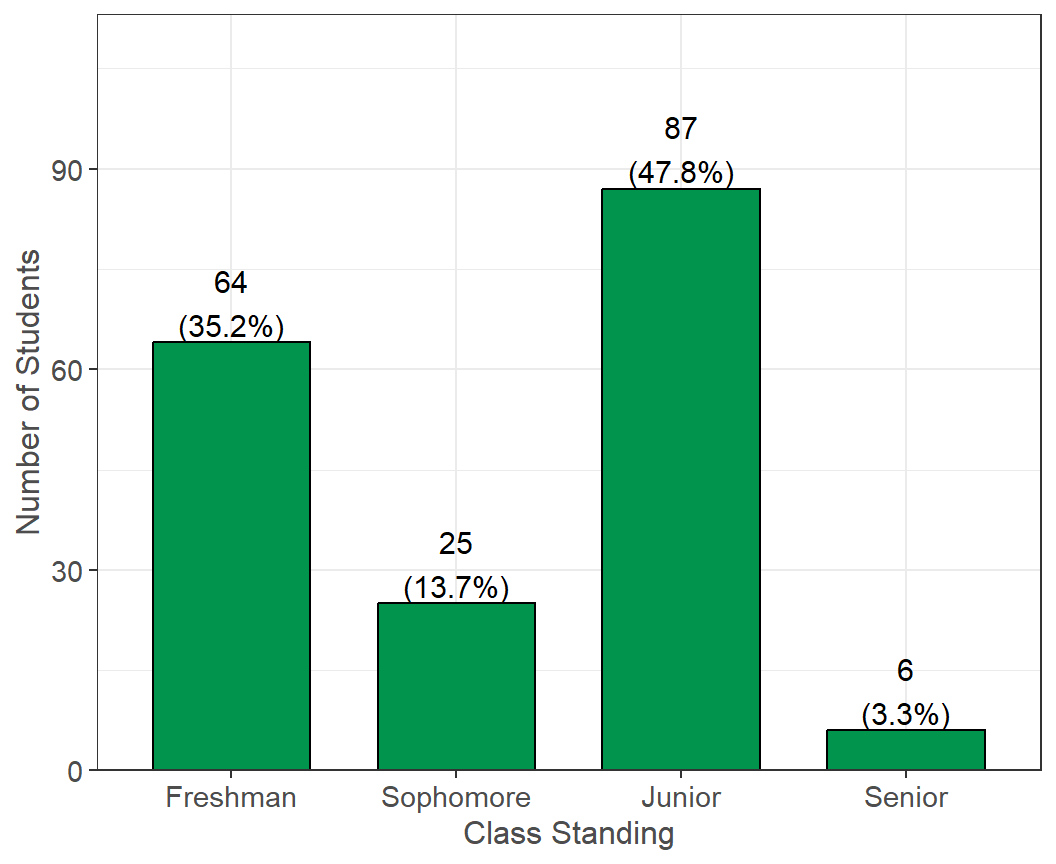
Survey Question: Estimate your class standing by units completed (do not include units from this semester/quarter):
Summary: Of the 182 students reporting, 64 (35.2%) were freshmen, 25 (13.7%) were sophomores, 87 (47.8%) were juniors, and 6 (3.3%) were seniors.
Major
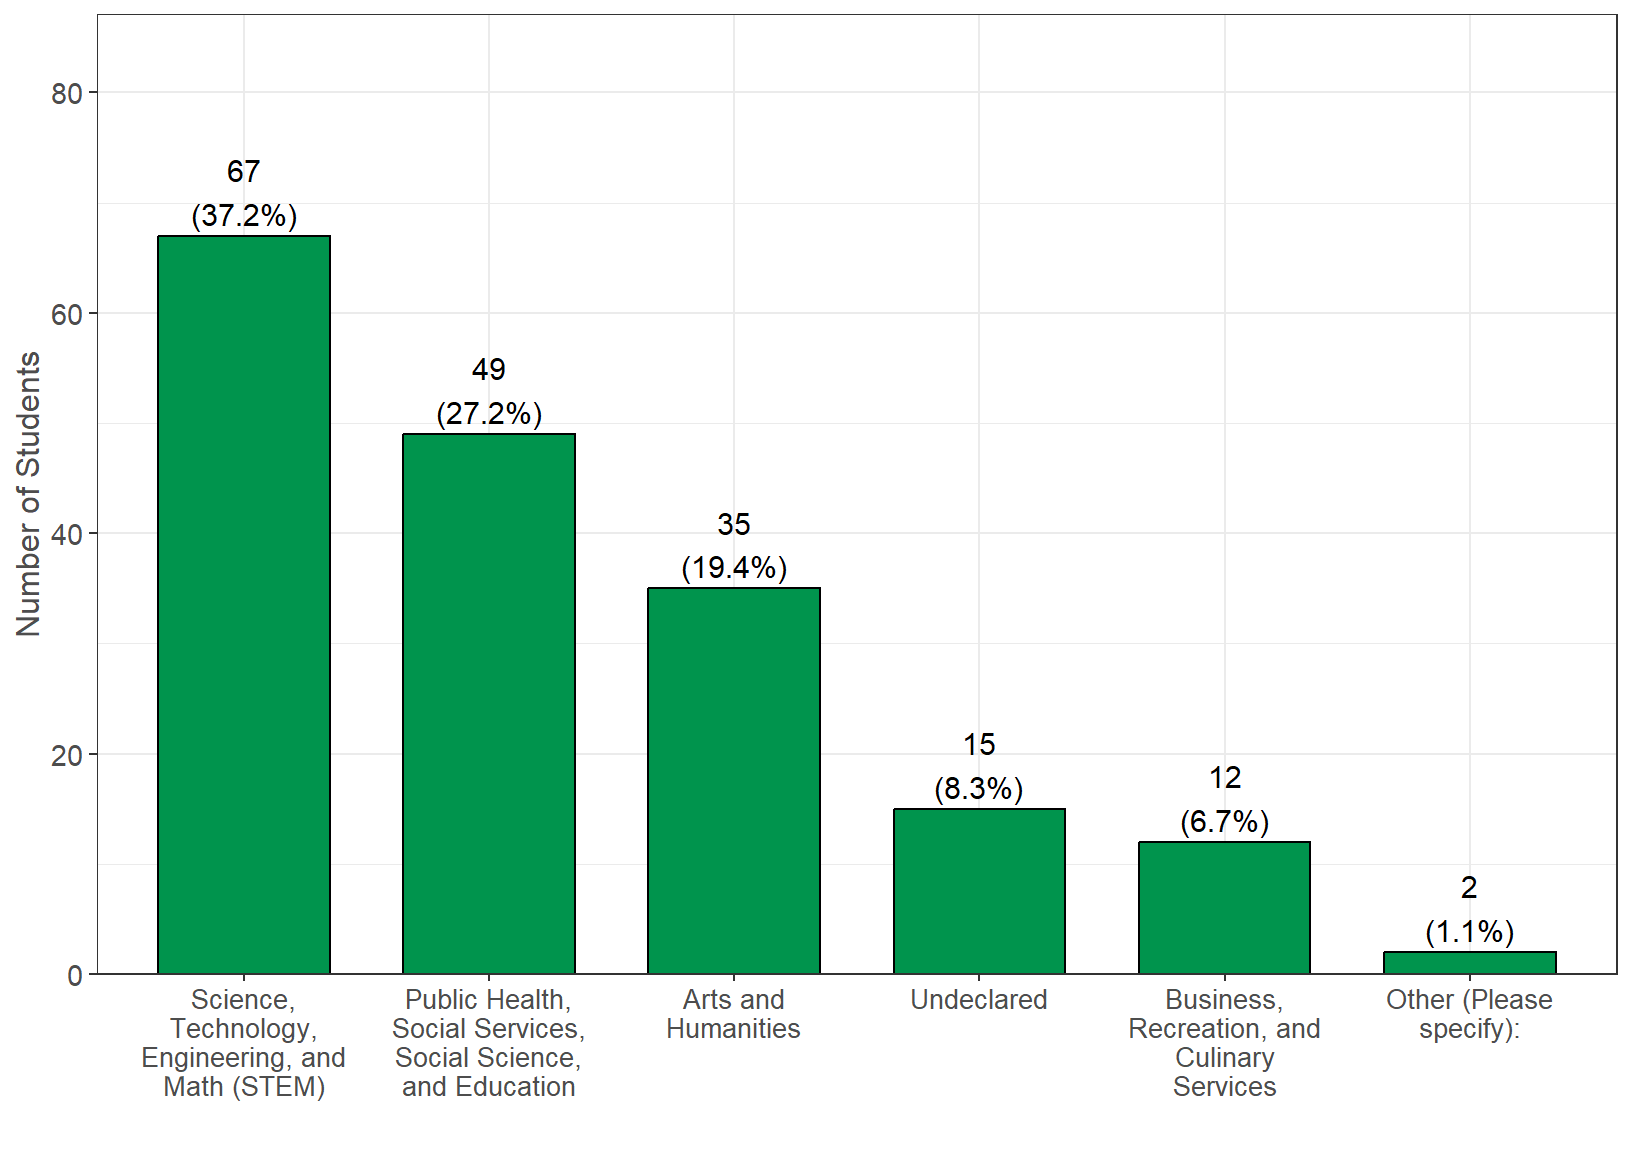
Survey Question: Which of the following categories best describes your major?
Additional Notes: Science, Technology, Engineering, and Math (STEM) was shortened for the figure above, but also includes the following majors: Medicine, Computer Science, Agriculture, Accounting, Statistics, Nursing, and Nutrition.
Summary: A total of 49 (27.2%) students were majoring in a Public Health, Social Services, Social Science, or Education, while 67 (37.2%) students majored in STEM.
Overall GPA
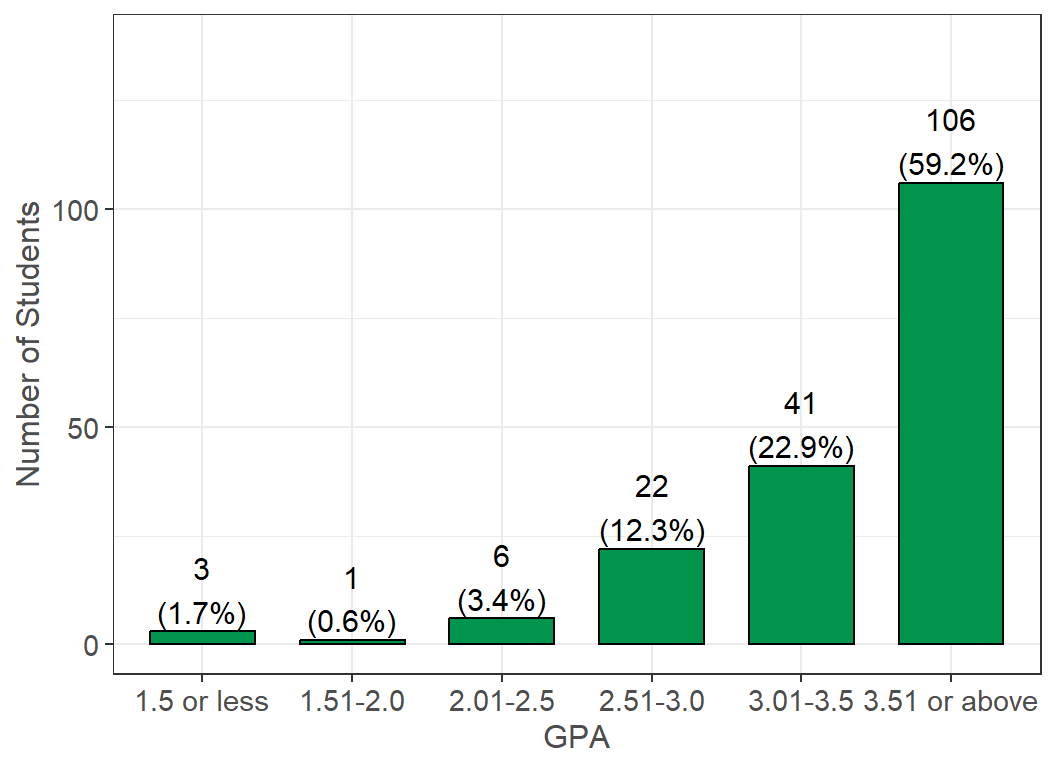
Survey Question: What is your approximate overall grade point average (GPA)? Remember that your GPA is on a scale from 0 to 4.0.
Summary: The average overall GPA for students was 3.65, while the median was 3.69. A total of 157 (87.2%) students had a GPA greater than or equal to 3.0, and 90 (50.0%) had a GPA greater than or equal to 3.7.
Currently Enrolled Units
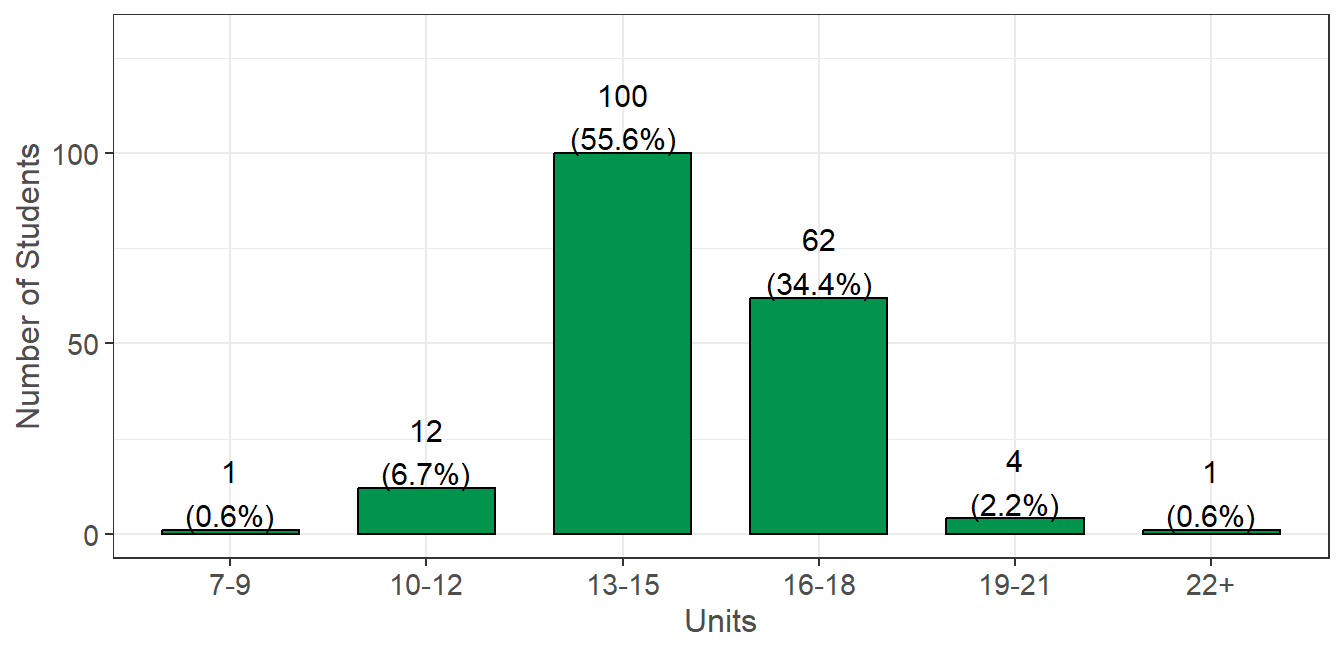
Survey Question: How many units are you currently taking?
Summary: Students were enrolled in an average of 14.77 units, while the median was 15. A total of 176 (97.8%) students were considered full-time (12 or more units), with 16 units being the most common response and 13 units being the second most common.
I identify as…
| Student Identifiers: | Yes (%) |
|---|---|
| A Transfer Student. (n = 179) | 84 (46.9%) |
| An ESL (English as a Second Language) student. (n = 178) | 53 (29.8%) |
| LGBTQA+. (n = 168) | 45 (26.8%) |
| A student with a disability. (n = 167) | 31 (18.6%) |
| A student receiving services through my campus for a disability. (n = 179) | 21 (11.7%) |
| A non-California resident (not International). (n = 177) | 11 (6.2%) |
| A DREAM (i.e. undocumented) student. (n = 179) | 8 (4.5%) |
| A student athlete. (n = 178) | 6 (3.4%) |
| A former foster youth/child. (n = 180) | 3 (1.7%) |
| An International student. (n = 179) | 3 (1.7%) |
| A DACA (i.e. Deferred Action for Childhood Arrivals) student. (n = 180) | 3 (1.7%) |
| A Veteran of military service. (n = 180) | 0 (0.0%) |
Survey Question: Please check any statement below that you identify with.
Additional Notes: Students selected from the following options: “Yes,” “No,” and “I don’t know.” Responses of “I don’t Know” were set as missing values. The n count next to each label represents the total number of non-missing responses.
Summary: A total of 84 (46.9%) of students identified as transfer students, 53 (29.8%) identified as students with English as their second language, and 45 (26.8%) identified as LGBTQA+.
Academic Performance & Activities
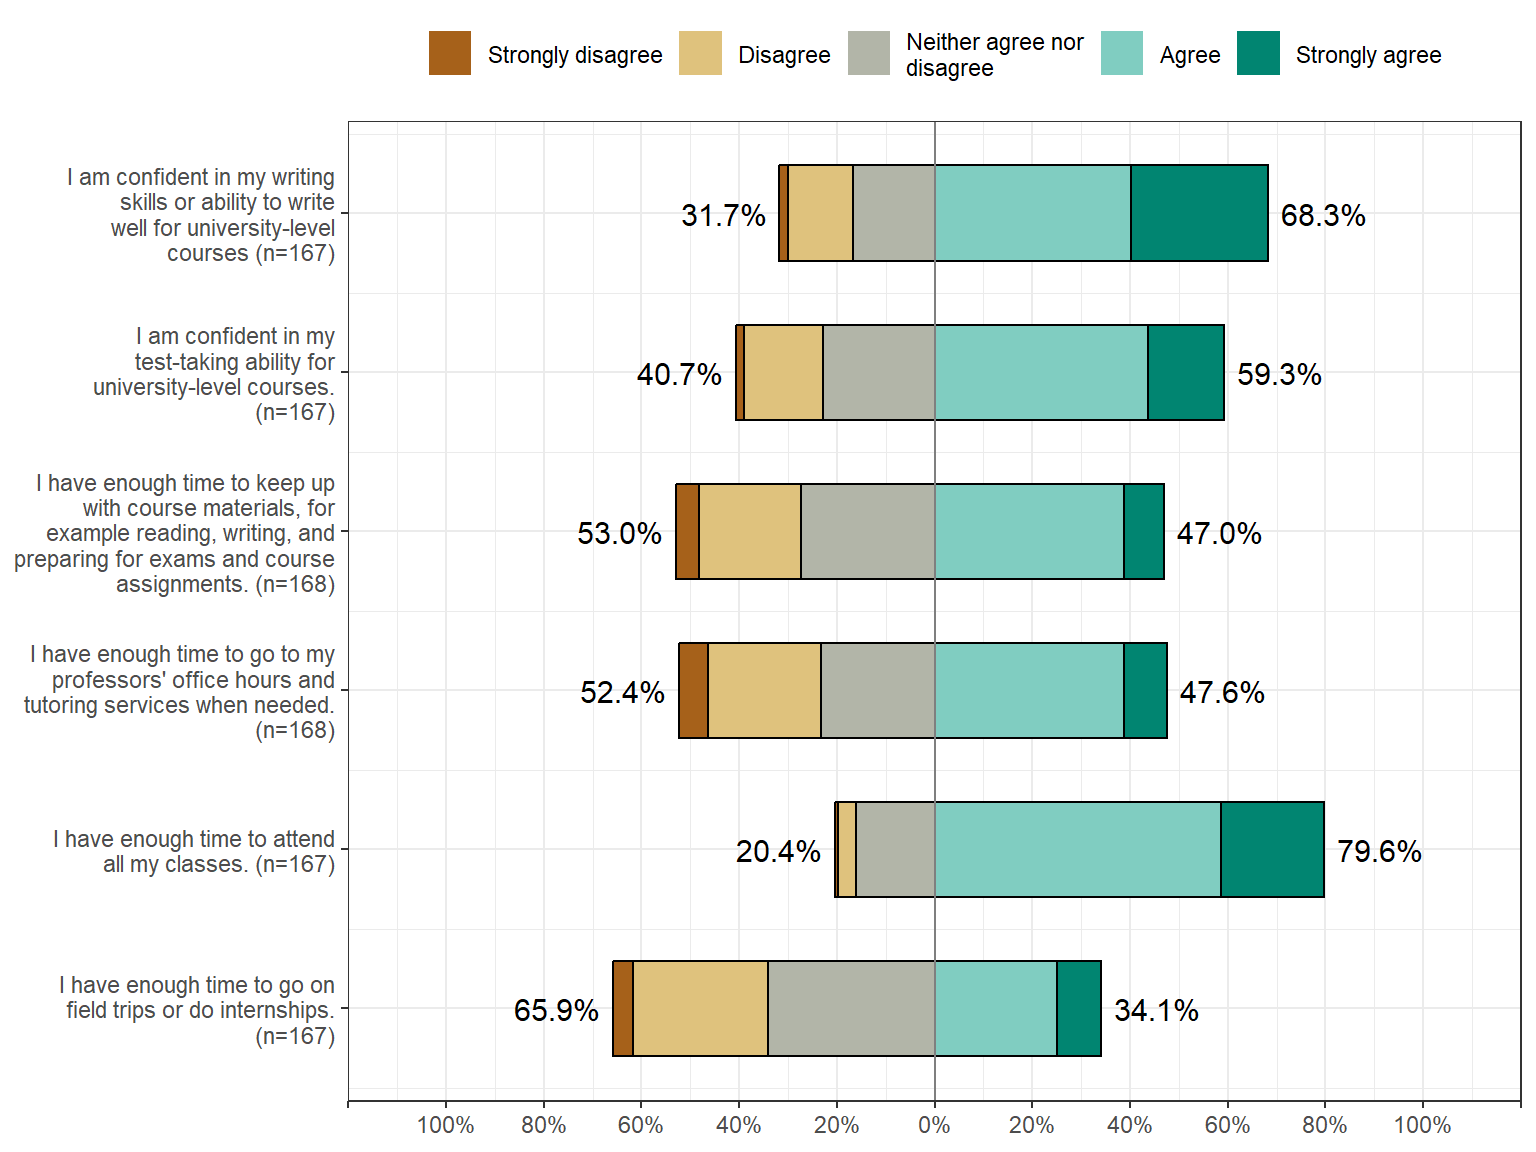
Summary: For each of the following statements, indicate how strongly you agree or disagree about the time you have available for these academic activities and your confidence in your academic performance.
Summary: Some highlights of the results include the following: A total of 114 (68.3%) agreed or strongly agreed that they were confident in their writing skills; 89 (53.0%) were neutral, disagreed, or strongly disagreed that they had enough time to keep up with course material; 88 (52.4%) were neutral, disagreed, or strongly disagreed that they had enough time to go to office hours; and 34 (20.4%) were neutral, disagreed, or strongly disagreed that they had enough time to attend class.
![]()