Student Demographics
Major, GPA, & Units
What is your major at CSU, Chico?
| Major | Frequency |
|---|---|
| accounting | 2 |
| agriculture crop science | 1 |
| animal science | 2 |
| anthropology | 2 |
| anthropology - pre med | 1 |
| art studio | 1 |
| biochemistry | 1 |
| biology | 1 |
| business- finance | 1 |
| business administration | 3 |
| business administration - finance | 1 |
| business administration human resource | 1 |
| business entrepreneurship | 1 |
| business information systems | 1 |
| business management | 2 |
| cell molecular biology | 1 |
| chemistry | 1 |
| child development | 8 |
| child development and social work | 1 |
| civil engineering | 2 |
| cj | 1 |
| communication science and disorder | 1 |
| communication science and disorders | 1 |
| communication sciences and disorders | 1 |
| communication studies | 2 |
| computer animation and game development | 1 |
| concrete industry management | 1 |
| concrete industry management minor in business | 1 |
| construction management | 1 |
| construction management & concrete industry management | 1 |
| criminal justice | 12 |
| criminal justice and psychology | 1 |
| english education | 2 |
| exercise physiology | 4 |
| game developtment | 1 |
| graphic design | 1 |
| health education | 2 |
| health science | 3 |
| health science admin | 1 |
| health science administration | 1 |
| health science with an emphasis in health education | 1 |
| health science: education | 1 |
| health services administration | 1 |
| journalism- public relations | 1 |
| kinesiology (movement studies) | 1 |
| lbst/ comm. sciences and disorders | 1 |
| liberal studies | 4 |
| math education | 1 |
| mathematics - statistics | 1 |
| mechanical engineering | 1 |
| mechatronic engineering | 1 |
| microbiology | 1 |
| multicultural gender studies | 1 |
| nutrition and food science | 1 |
| nutritiona and food science | 1 |
| organizational communications | 1 |
| parks and rec | 1 |
| parks and recs | 1 |
| pre-nursing | 1 |
| pre nursing | 1 |
| pre recording arts min;afam studies | 1 |
| psychological sciences | 1 |
| psychology | 19 |
| psychology and child development | 1 |
| psychology and spanish | 1 |
| psychology/criminal justice | 1 |
| public admin | 1 |
| public health | 1 |
| public relations | 1 |
| pyschology | 1 |
| recording arts and music industry | 1 |
| recreational therapy | 1 |
| social work | 4 |
| sociology | 14 |
| spanish | 2 |
| studio art | 1 |
| undeclared or not decided | 3 |
What is your approximate overall Grade Point Average (GPA) for your current degree in progress? ⭐
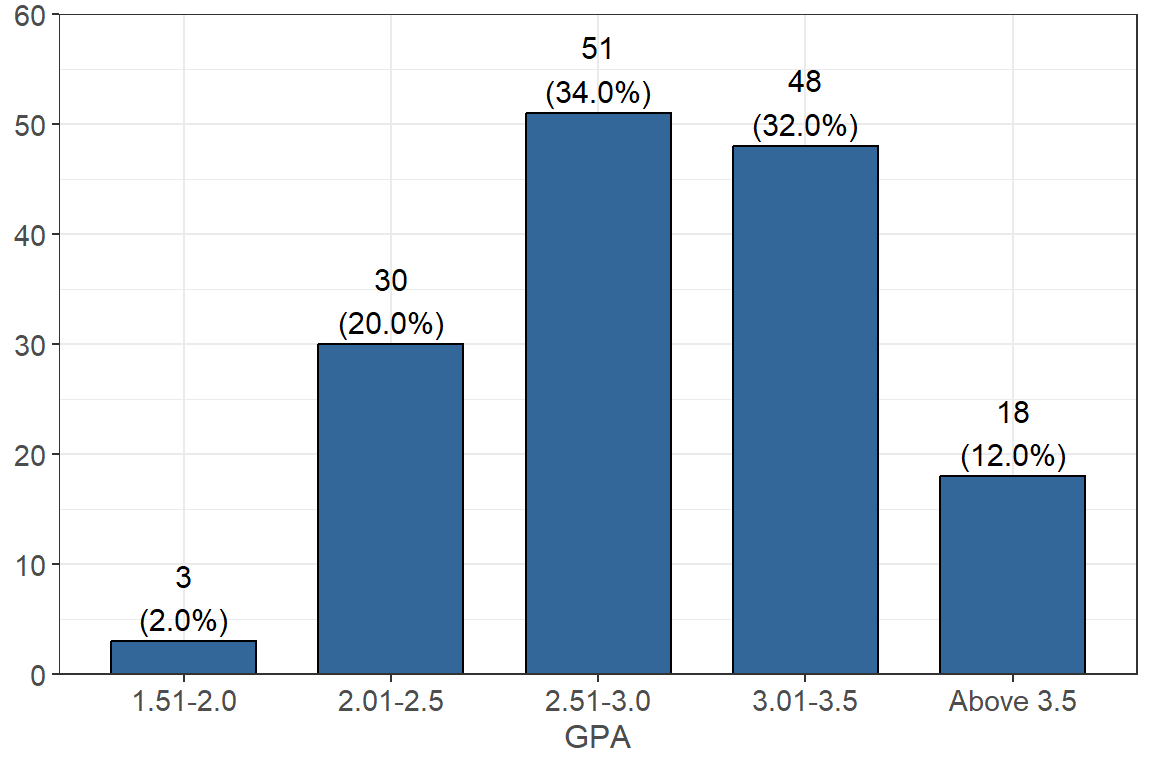
About a third, or 34.0% (n = 51), of participants reported that their GPA is between 2.51 and 3.0, 32.0% (n = 48) reported that their GPA is between 3.01 and 3.5, and 20.0% (n = 30) reported that their GPA is between 2.01 and 2.5. 12.0% (n = 18) reported that their GPA is above 3.5 and lastly 2.0% (n = 3) reported that their GPA is between 1.51 and 2.0.
Estimate your class level for the 2018-2019 academic school year by units completed (do not include units currently in progress this semester) ⭐
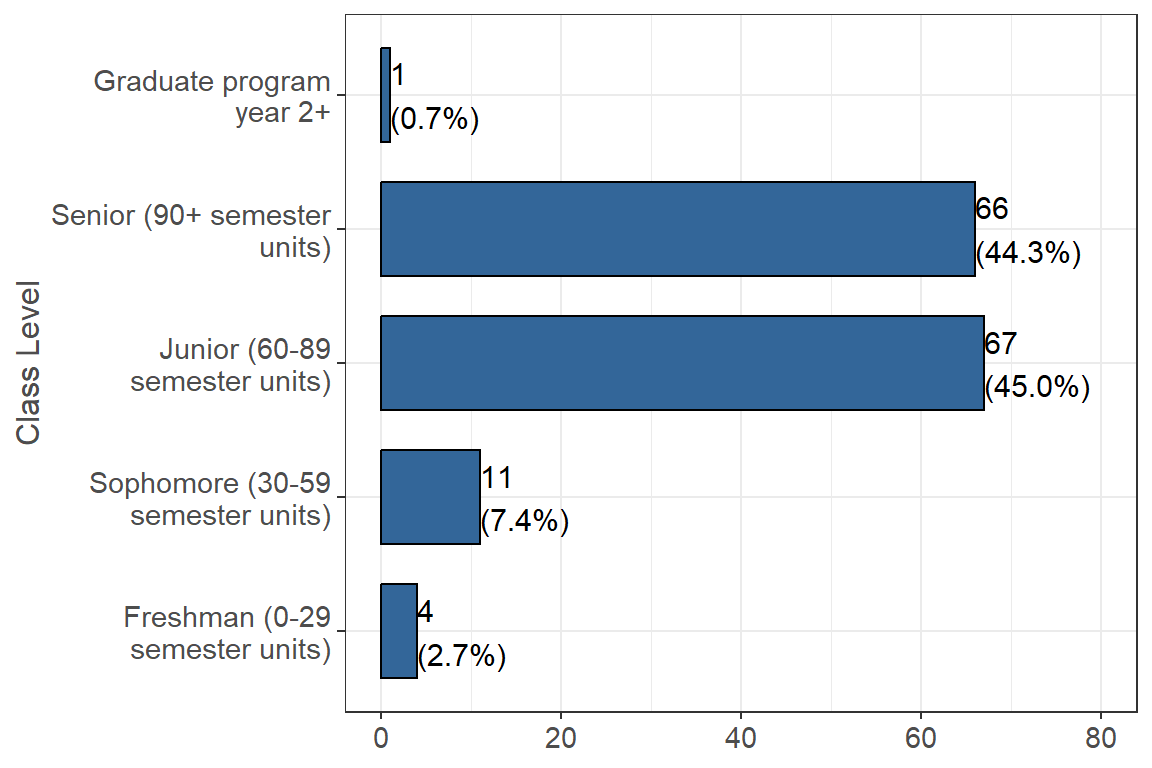
Just under half, or 45.0% (n = 67) of respondents, reported that they are Juniors (60-89 units), 44.3% (n = 66) reported that they are Seniors (90+ units), 7.4% (n = 11) reported that they are Sophomores (30-59 units), 2.7% (n = 4) reported that they are Freshman (0-29 units), and lastly 0.7% (n = 1) reported that they are a Graduate Student year 2+.
What month and year did you first attend Chico State?
| Matriculation Date | Frequency |
|---|---|
| 2012-08-01 | 1 |
| 2013-06-01 | 1 |
| 2013-08-01 | 5 |
| 2014-08-01 | 15 |
| 2015-05-01 | 1 |
| 2015-06-01 | 1 |
| 2015-08-01 | 34 |
| 2016-08-01 | 43 |
| 2016-09-01 | 1 |
| 2017-01-01 | 4 |
| 2017-08-01 | 12 |
| 2018-01-01 | 1 |
| 2018-08-01 | 23 |
| 2019-01-01 | 6 |
| 2019-08-01 | 2 |
Out of all the students who took this survey, the student who attended Chico state the earliest started in 08/01/2012 and the two students who attended the latest started in 08/01/2019.
What month and year do you expect to graduate from Chico State to earn your current degree?
| Expected Graduation Date | Frequency |
|---|---|
| 2019-05-31 | 35 |
| 2019-08-31 | 1 |
| 2019-12-31 | 14 |
| 2020-05-31 | 38 |
| 2020-08-31 | 1 |
| 2020-12-31 | 16 |
| 2021-05-31 | 31 |
| 2022-05-31 | 8 |
| 2023-05-31 | 2 |
Out of all the students who took this survey, the student who expects to graduate the earliest expects to graduate in 05/31/2019 and the student who expects to graduate the latest expects to graduate in 05/31/2023.
Have you taken a semester off since you began attending Chico State? If so, how many?
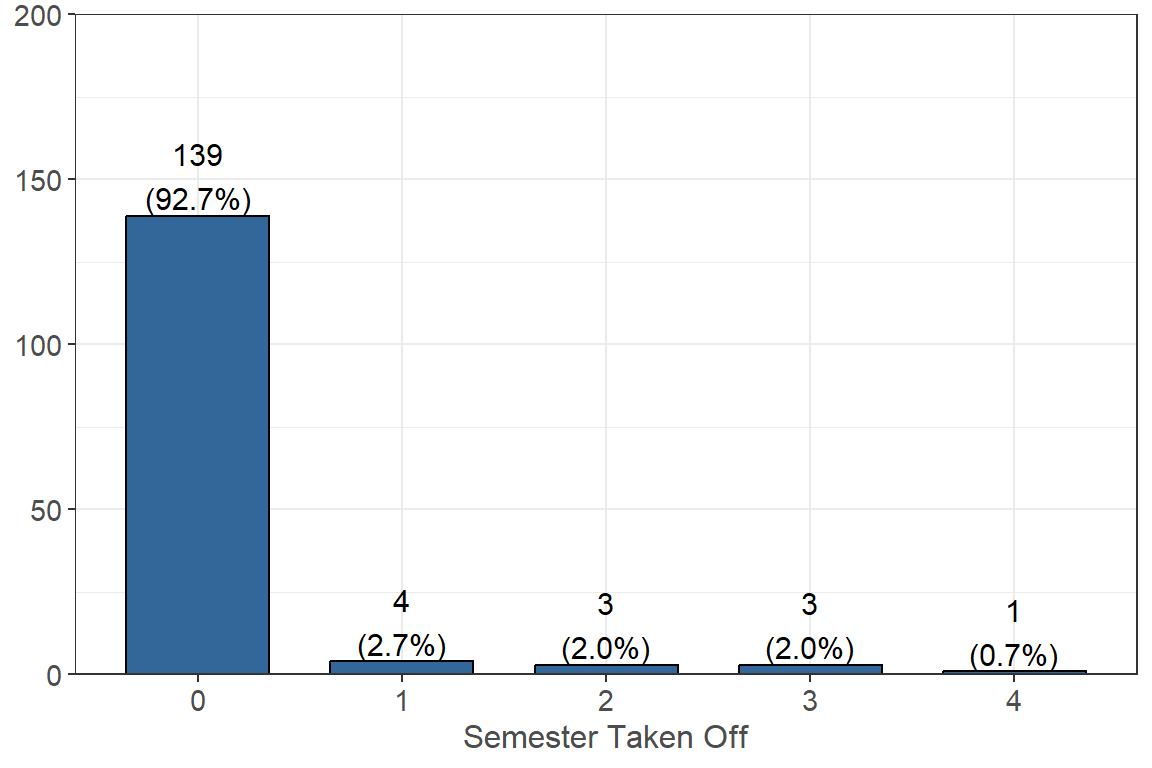
The majority of respondents, or 92.7% (n = 139), reported that they have not taken a semester off since they began attending Chico State, 2.7% (n = 4) reported that they took 1 semester off, 2.0% (n = 3) reported that they took 2 semesters off, 2.0% (n = 3) reported that they took 3 semesters off, and lastly 0.7% (n = 1) reported that they took 4 semesters off.
Student Identifiers
I identify as a(an)… ⭐
| Percentage | |
|---|---|
| Transfer student | 40/150 (26.7%) |
| Former foster youth/child | 7/150 (4.7%) |
| International student | 0/150 (0%) |
| Non-California resident (Not International) | 4/149 (2.7%) |
| College prep program* | 68/149 (45.6%) |
| EOP (Educational Opportunity Program) student | 110/148 (74.3%) |
| REACH (Raising Educational Achievement in Collaborative Hubs) student | 17/149 (11.4%) |
| ESL (English as a Second Language) student | 33/145 (22.8%) |
| Veteran of military service | 0/150 (0%) |
| Active duty military personnel | 0/150 (0%) |
| Student Athlete | 2/149 (1.3%) |
| DREAM (i.e. undocumented) student | 8/150 (5.3%) |
| DACA (i.e. Deferred Action for Childhood Arrivals) student | 8/150 (5.3%) |
I receive services through the Accessibility Resource Center or Disability Support Services Center
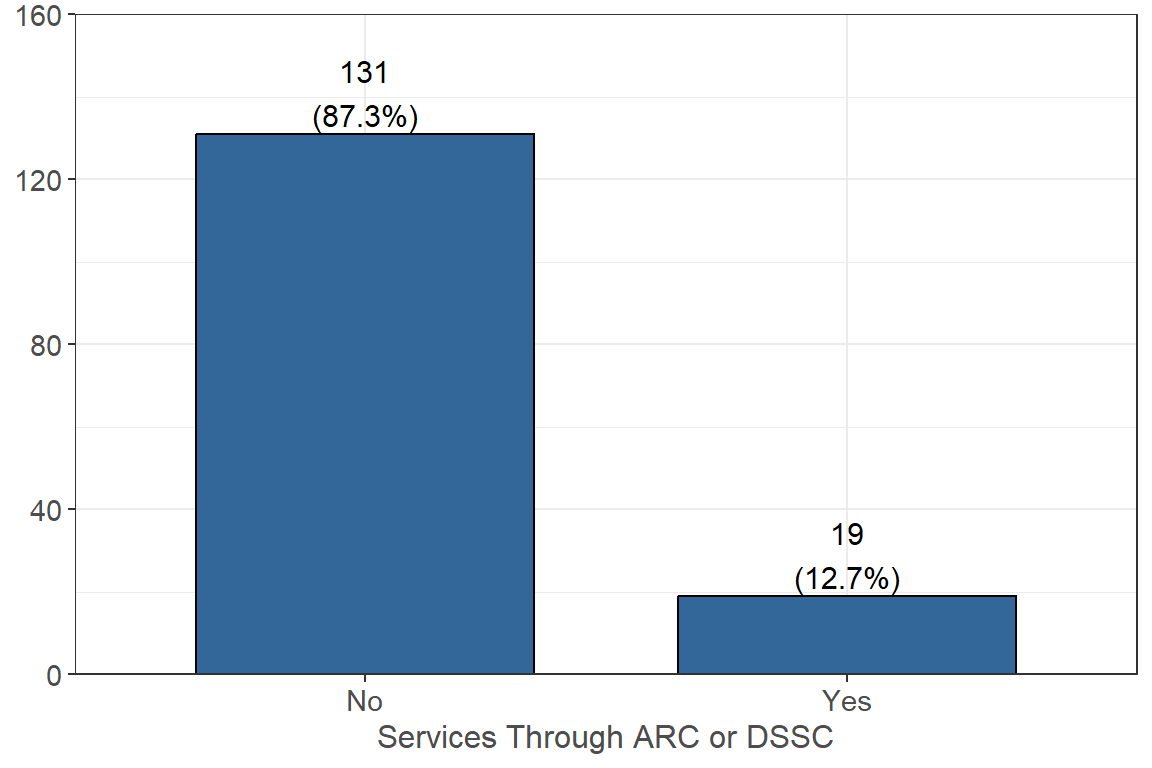
The majority of the students in this survey (87.3% n = 131) report they do not receive services through the Accessibility Resource Center or Disability Support Services Center and 12.7% (n = 19) report they do.
I am approved, awarded, or accepted for work study (with or without a work study job)

The majority of respondents, or 88.0% (n = 125), reported that they are approved, awarded, or accepted for work study, and 12.0% (n = 17) are not.
I participate in CalWORKS (i.e. TANF or cash aid for needy families) or Aid to Families with Dependent Children (AFDC)
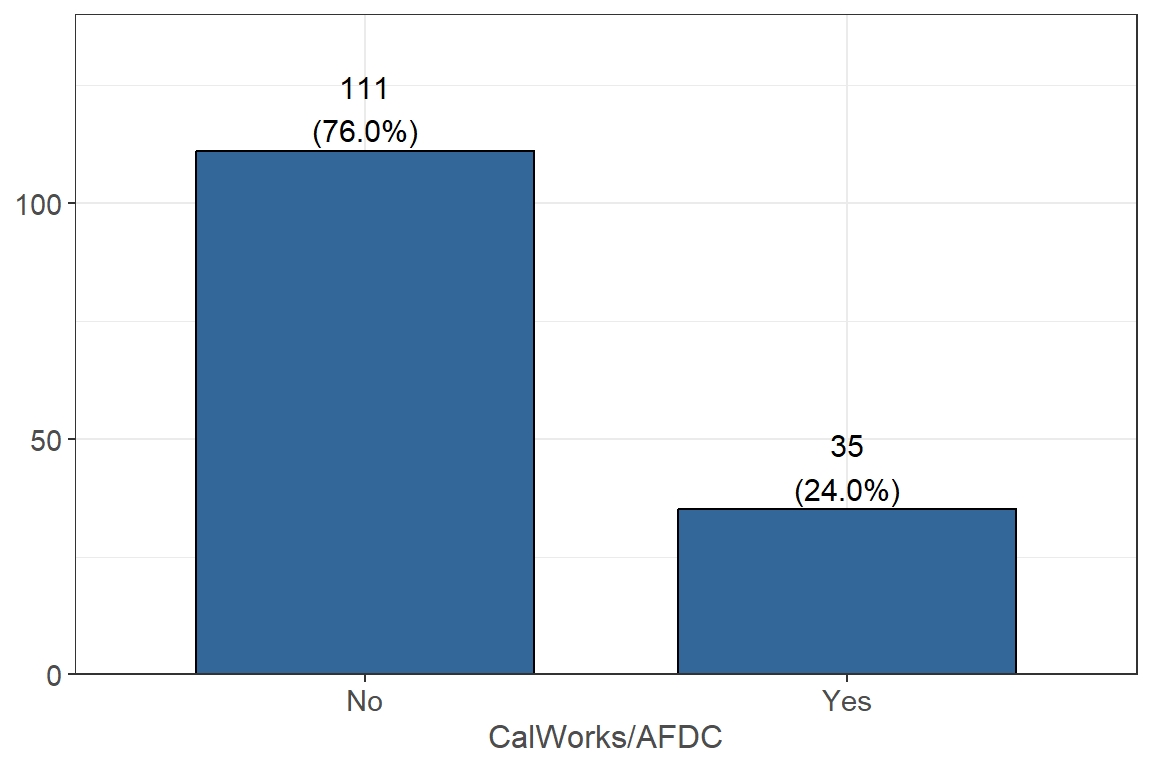
The majority of respondents, or 76.0% (n = 111), report that they do not participate in CalWORKS or Aid to Families with Dependent Children, and 24.0% (n = 35) report they do.
I participate in the Job Opportunities and Basic Skills (JOBS) Program
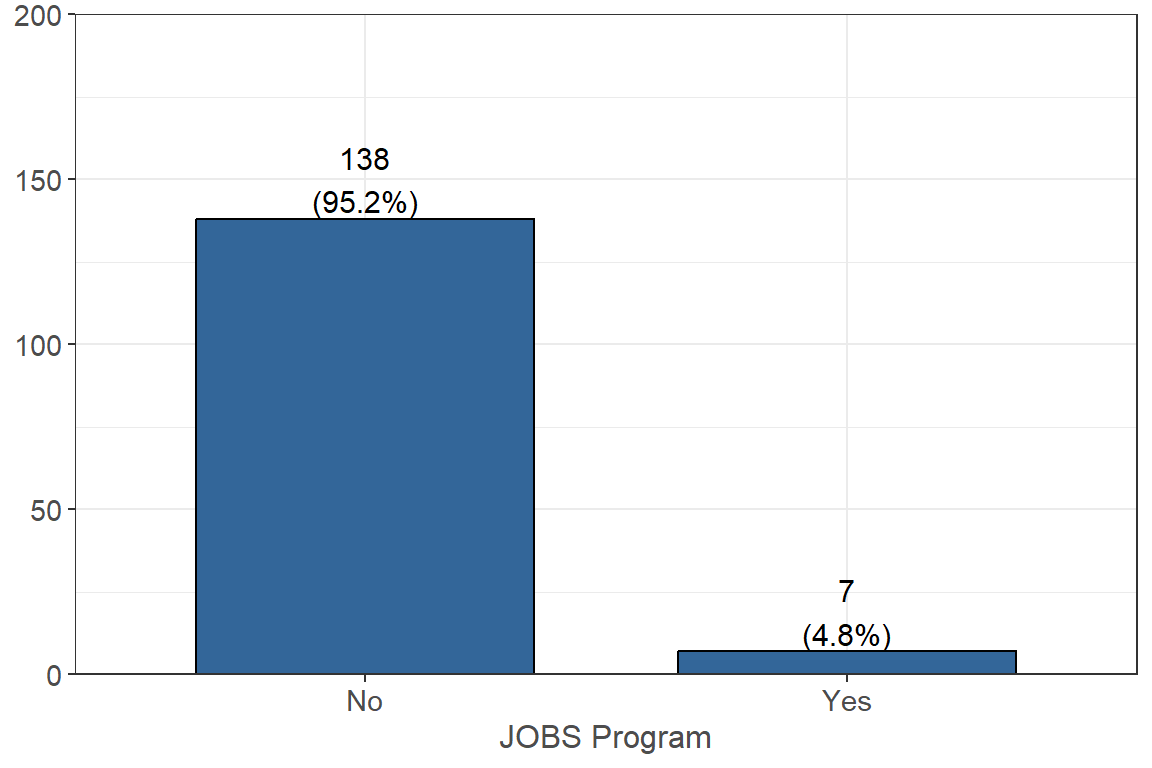
Most respondents, or 95.2% (n = 138), report that they do not participate in the Job Opportunities and Basic Skills program and 4.8% (n = 7) report they do.
I participate in the CalFresh Employment or Training (CFET) Program
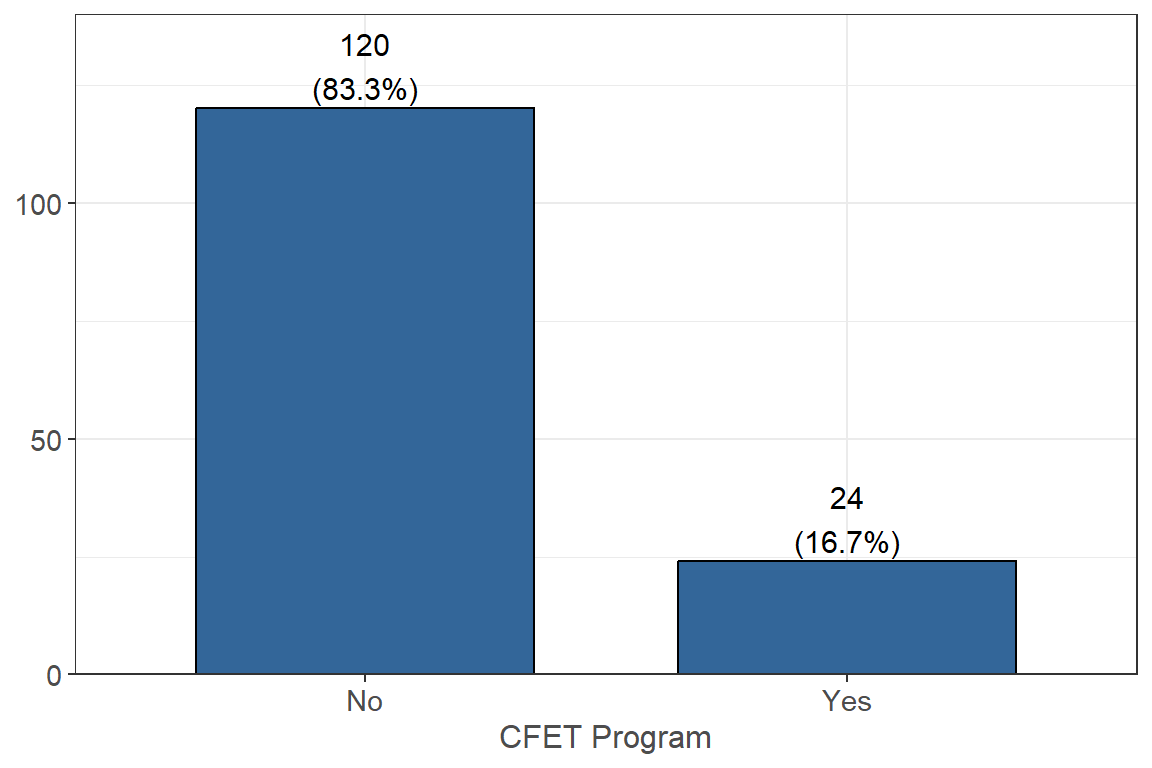
Of respondents, 83.3% (n = 120) report they do not participate in the CalFresh Employment or Training Program and 16.7% (n = 24) report they do not.
I am enrolled in Workforce Innovation and Opportunity Act (WIOA)
All respondents in this survey (100% n = 147) report that they are not enrolled in Workforce Innovation and Opportunity Act.
I am enrolled in Cooperative Agencies Resources for Education (CARE)
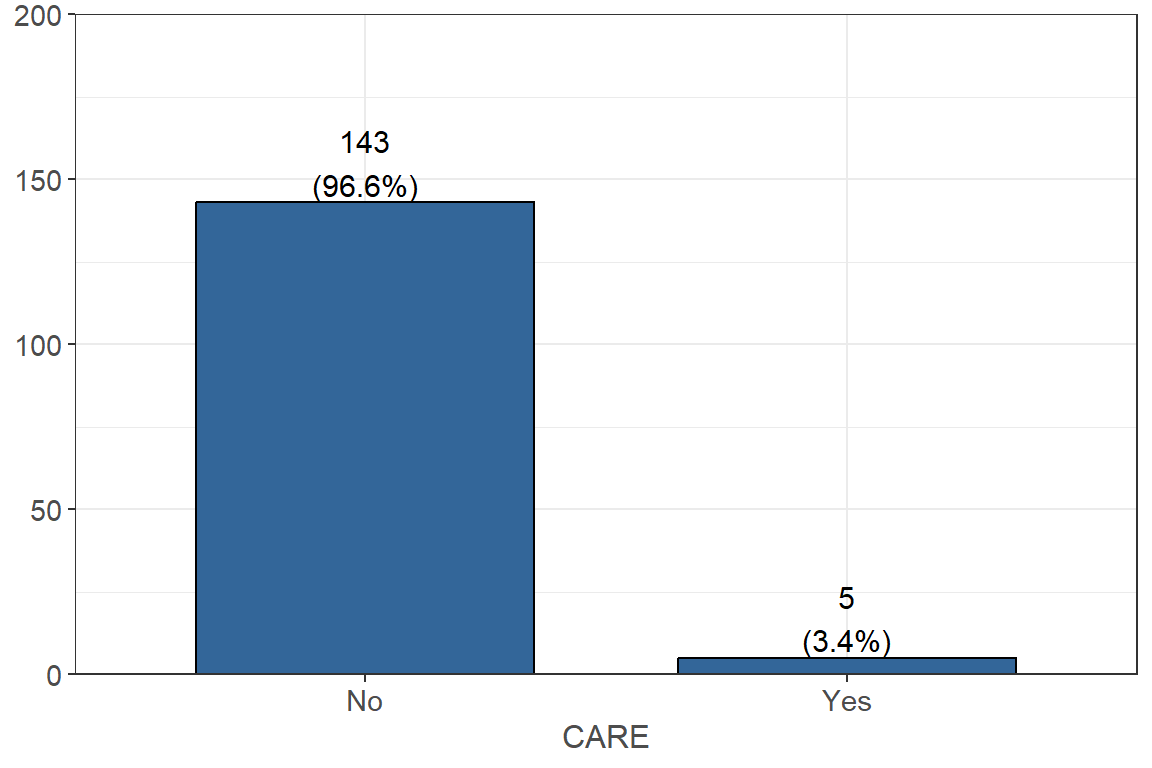
A very small percentage (3.4% n = 5) of respondents are enrolled in Cooperative Agencies Resources for Education with the majority (96.6% n = 143) are not.
I am enrolled in the Mathematics, Engineering, Science achievement (MESA) Program
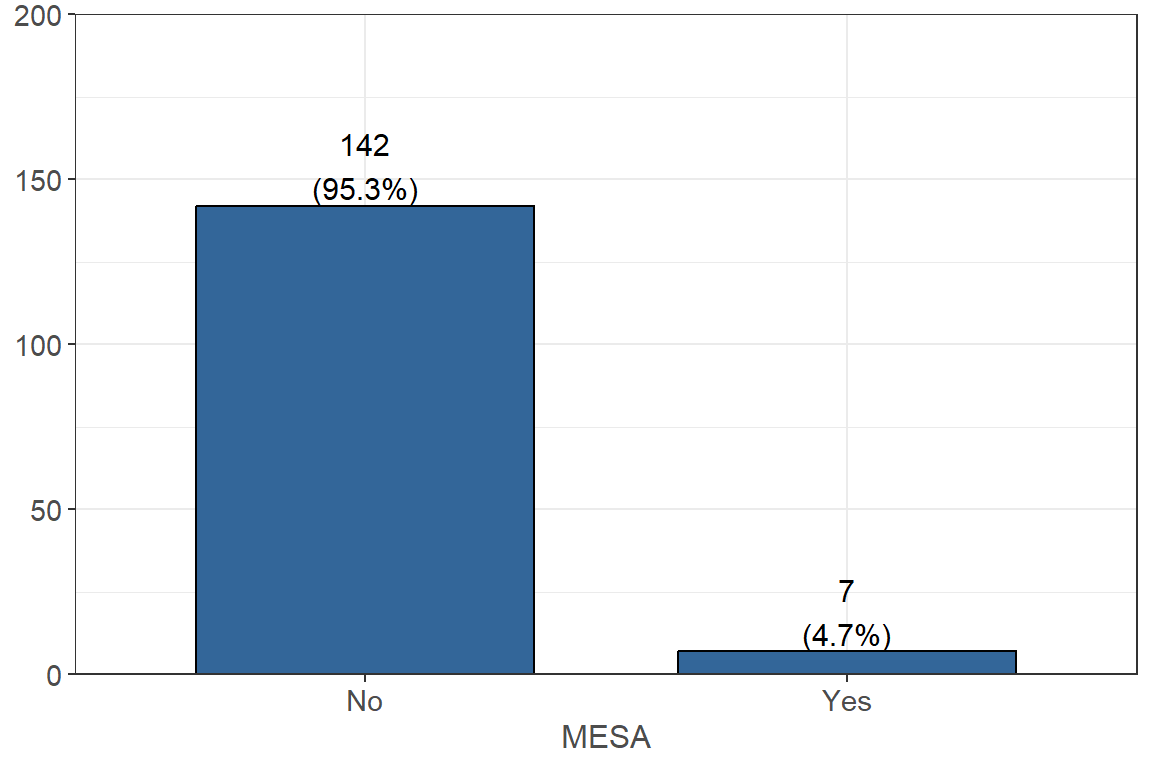
The majority of respondents (95.3% n = 142) reported that they are not enrolled in the MESA Program while 4.7% (n = 7) report they are.
I am a student attending CSU, receiving Cal Grant A OR B
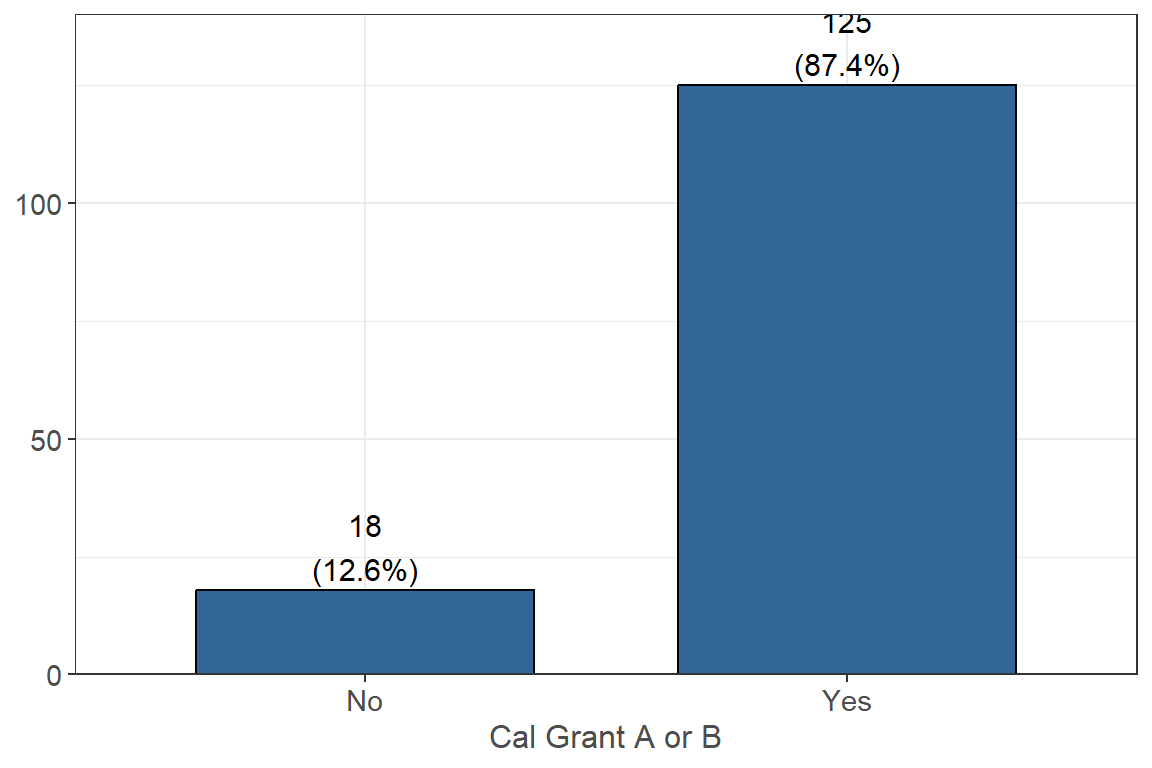
Most respondents, or 87.4% (n = 125), reported that they do receive either Cal Grant A or B while 12.6% (n = 18) reported they do not.
I am enrolled in a program that increases employability for current and former foster youth (Guardian Scholars, FYSI, CAFYES, ETV or Extended Foster Care)

A large proportion (96.6% n = 144) of respondents reported that they are not enrolled in a program that increases employability for current and former foster youth while 3.4% (n = 5) reported that they are.
I exert parental control over a dependent household member between the age of 6 and 12 with no adequate childcare
All respondents (100% n = 147) reported that they do not exert parental control over a dependent household member between the age of 6 and 12 with no adequate childcare.
I am a single parent of a dependent household member under the age of 12
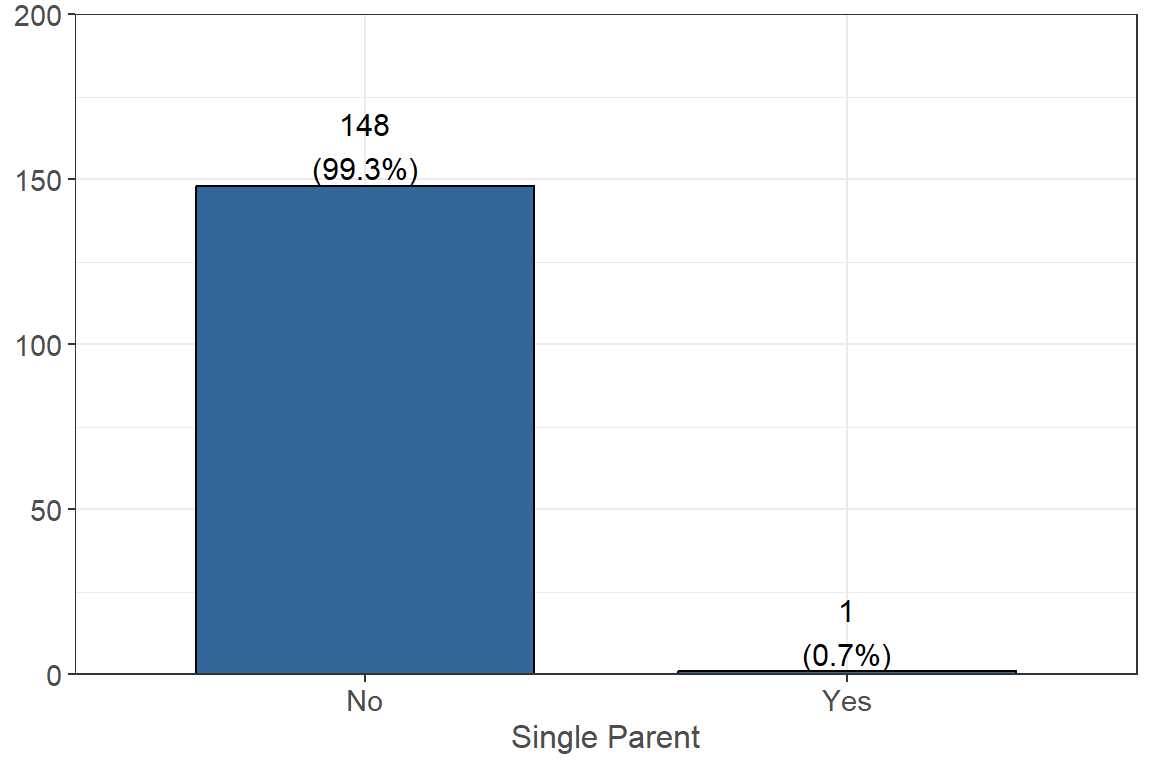
Only 1 (0.7%) person reported that they are a single parent of a dependent household member under the age of 12 while the rest (99.3% n = 148) reported they are not.
Personal Demographics
Click here to go to the Personal Demographics page